| < Previous page | Next page > |
|
Road Design - a complete example
Designing a Road (or any other regular construction such as channel, railroad, runways etc) with CDS.
Introduction
Since there are as many designs for any given piece of road as there are designers who attempt the task, it is not possible to provide a definitive method of road design.
Instead, what we hope to do here is to show you where the various tools 'live' within CDS, and how you can use some of them to create a road design across a 'Greenfield Site'.
We hope that this 'example' will empower you to look further into the tools available within CDS, and how you can apply them to your own projects.
And please don't constrict your thinking just because we have used the term 'road'.
The methodology outlined here can be easily applied to any 'structure' which has a 'regular design section'
The Task
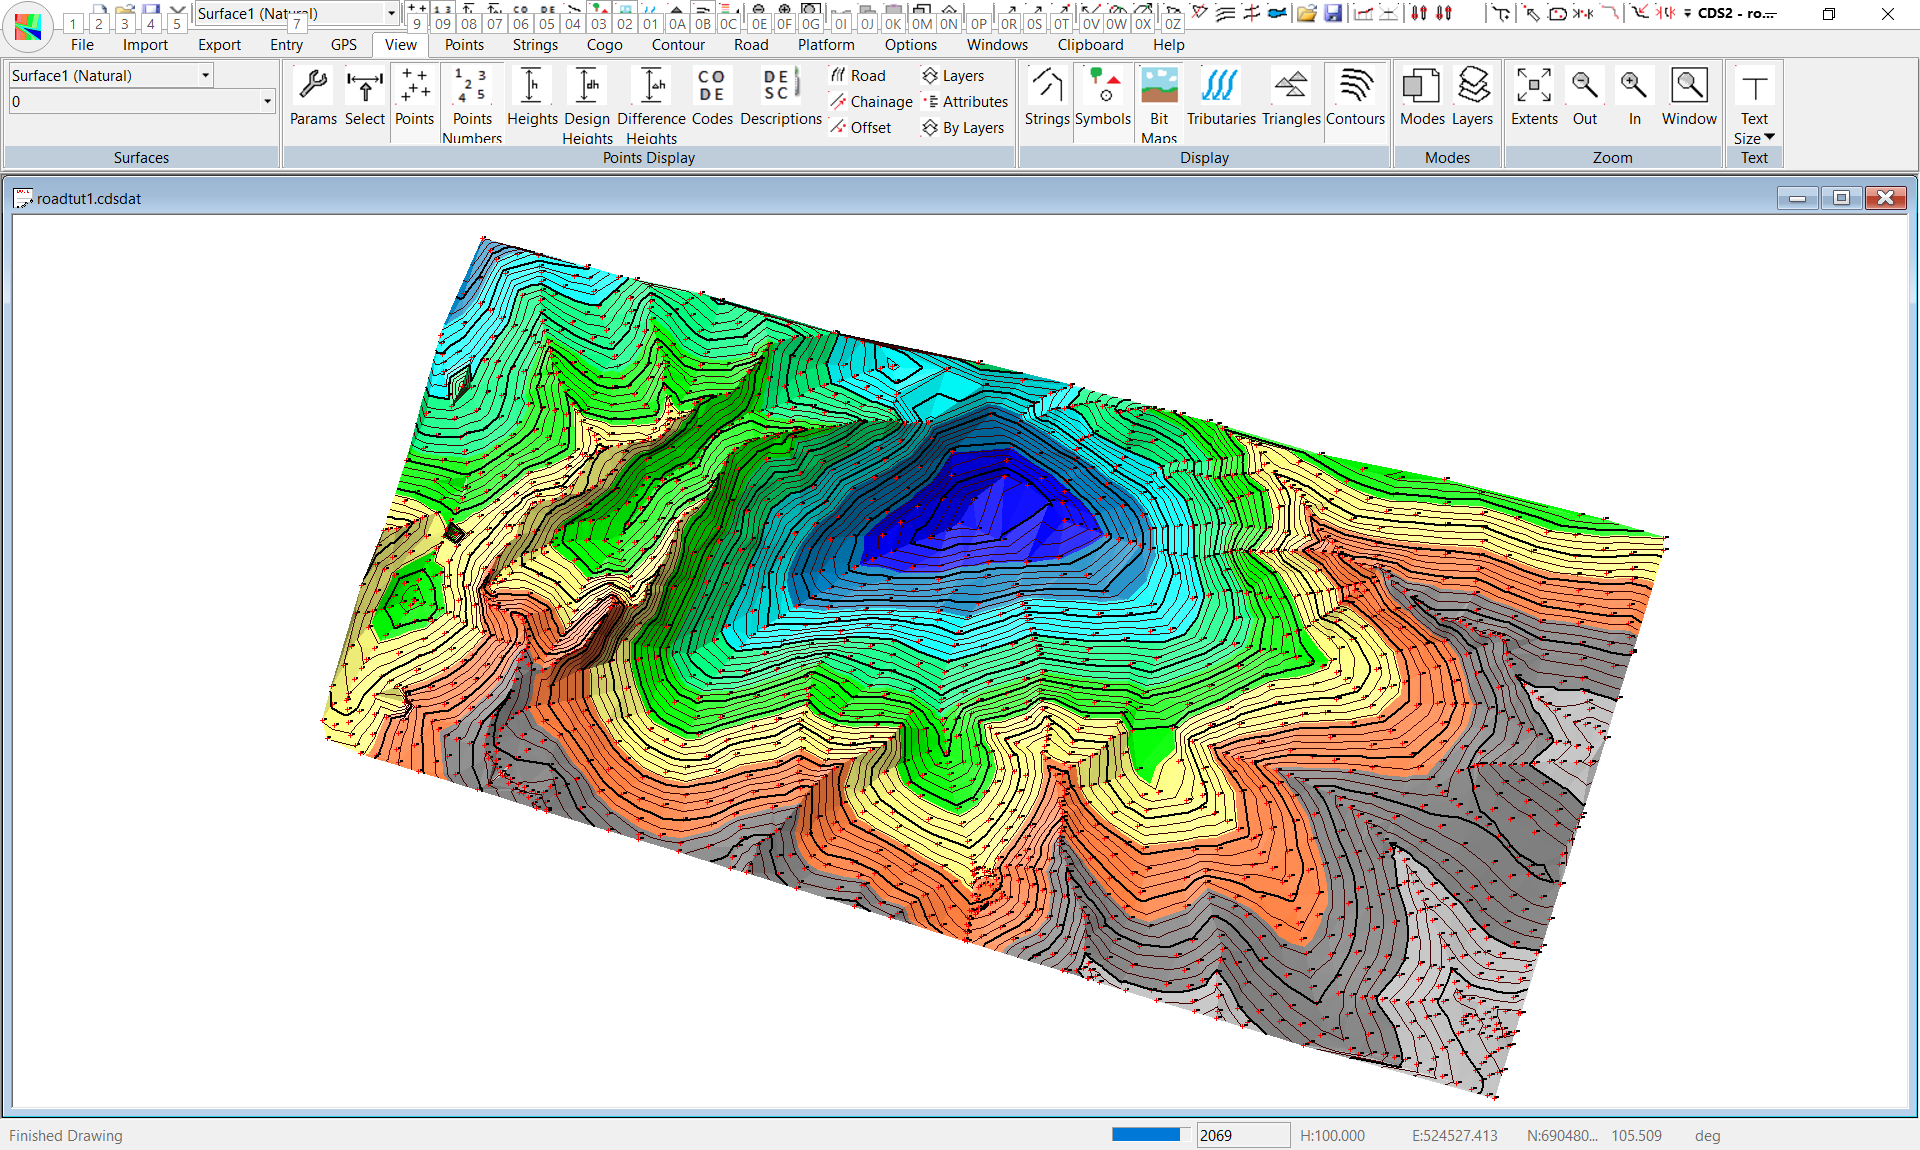
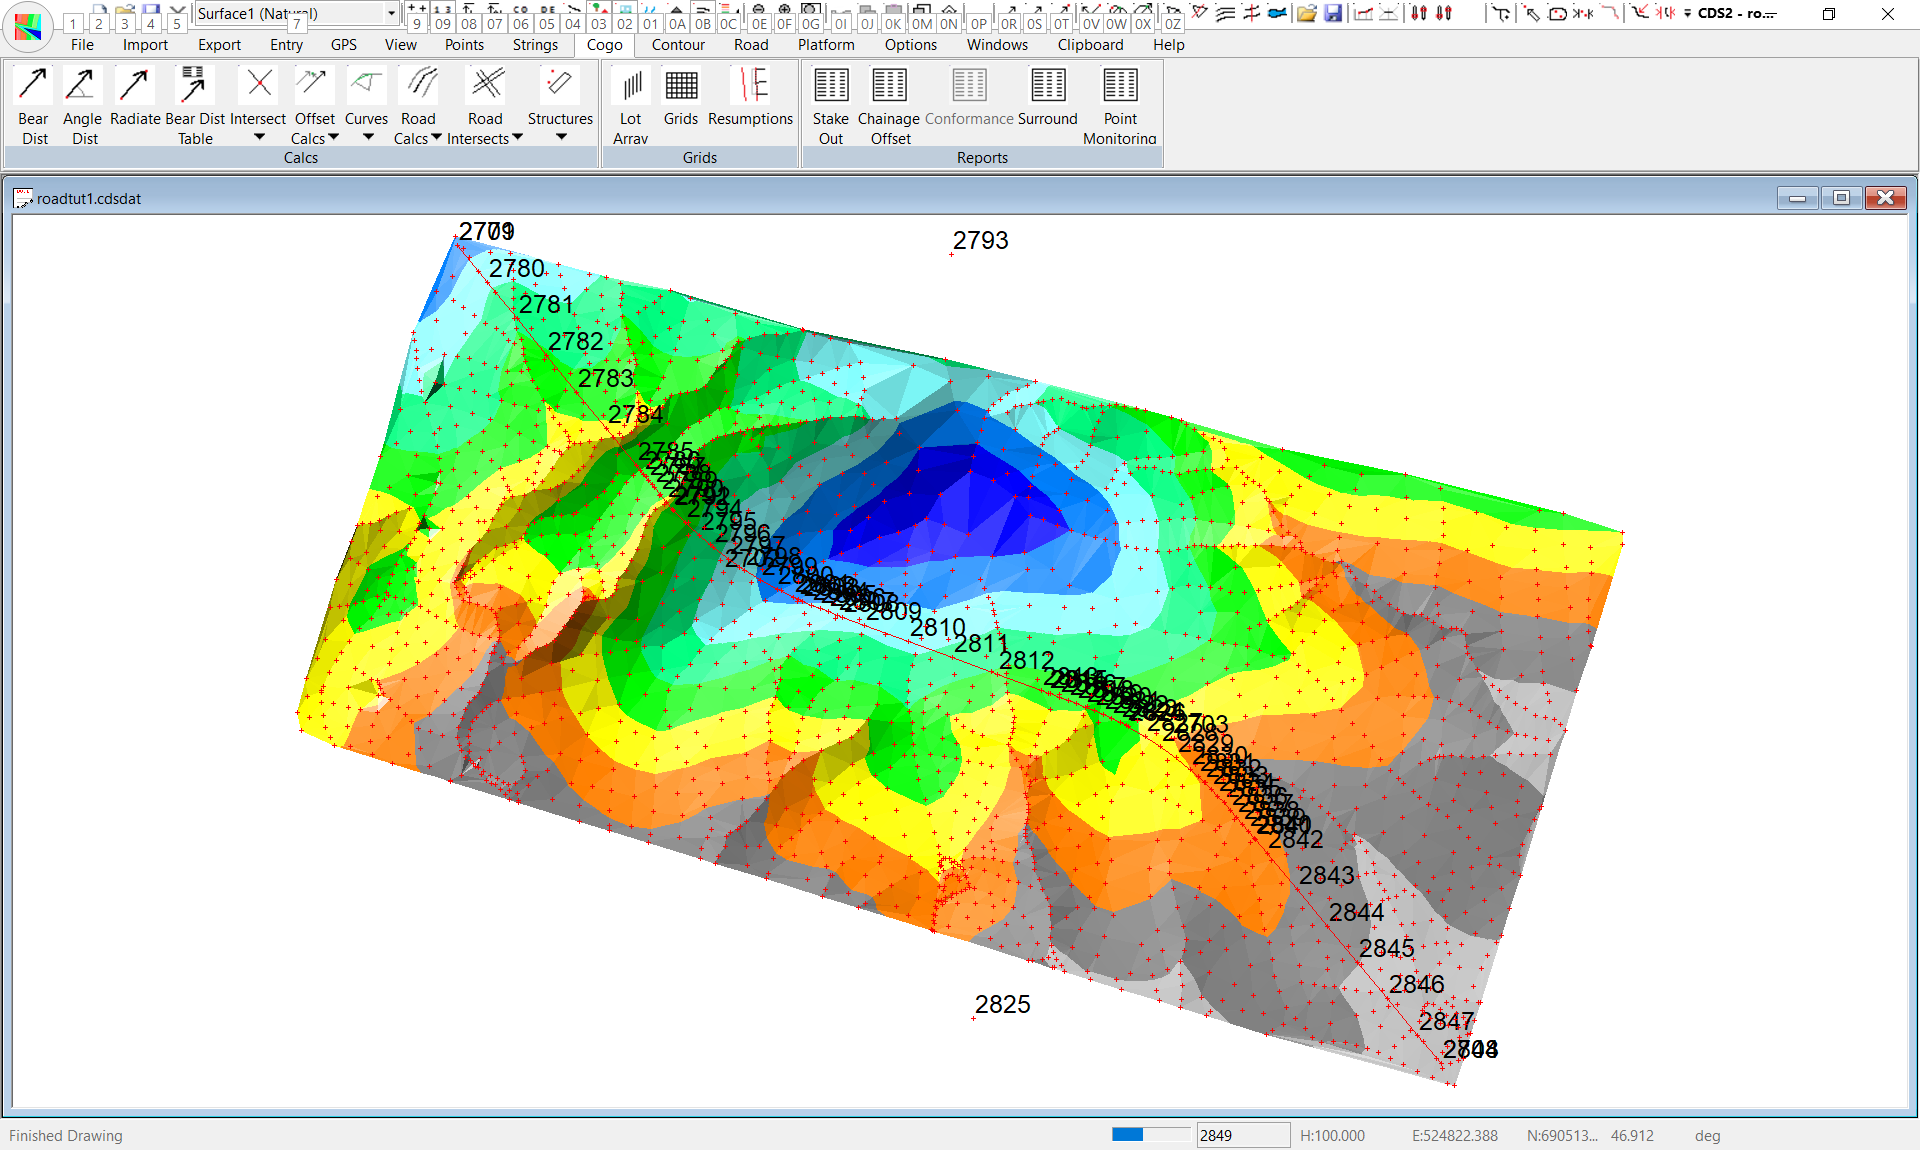
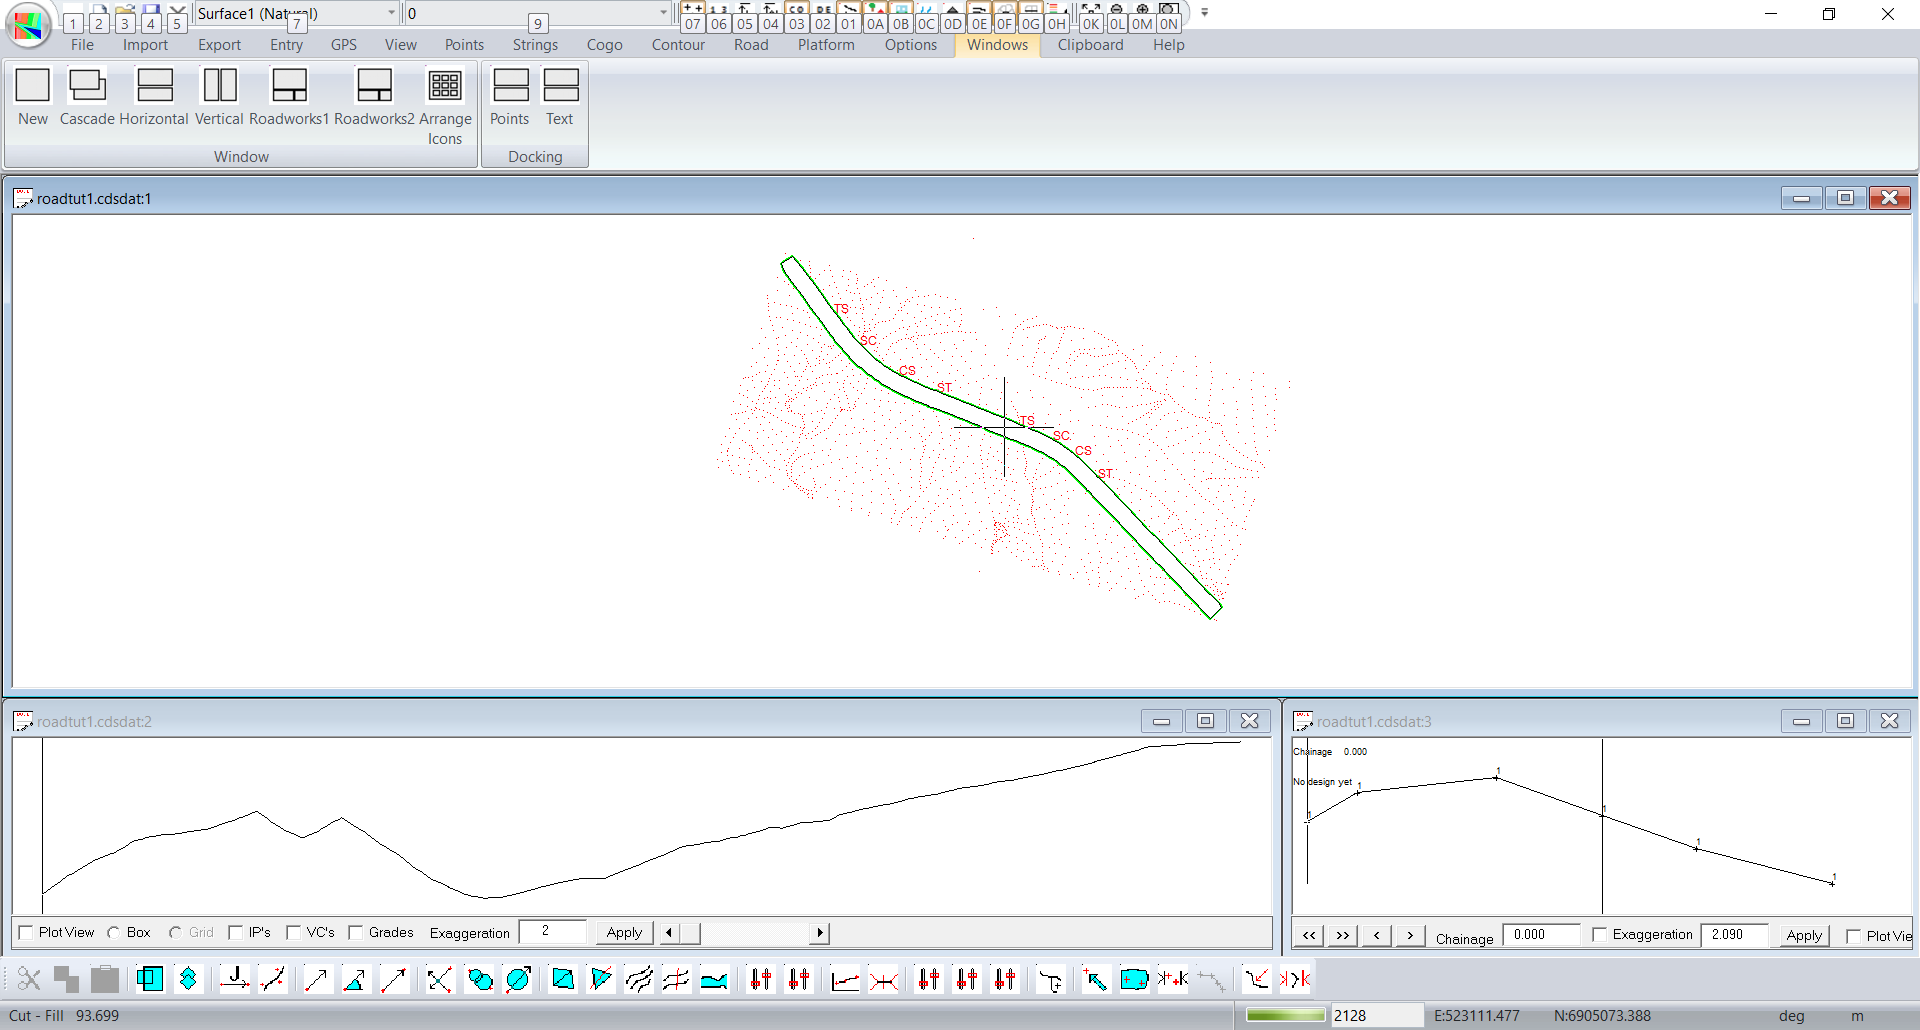
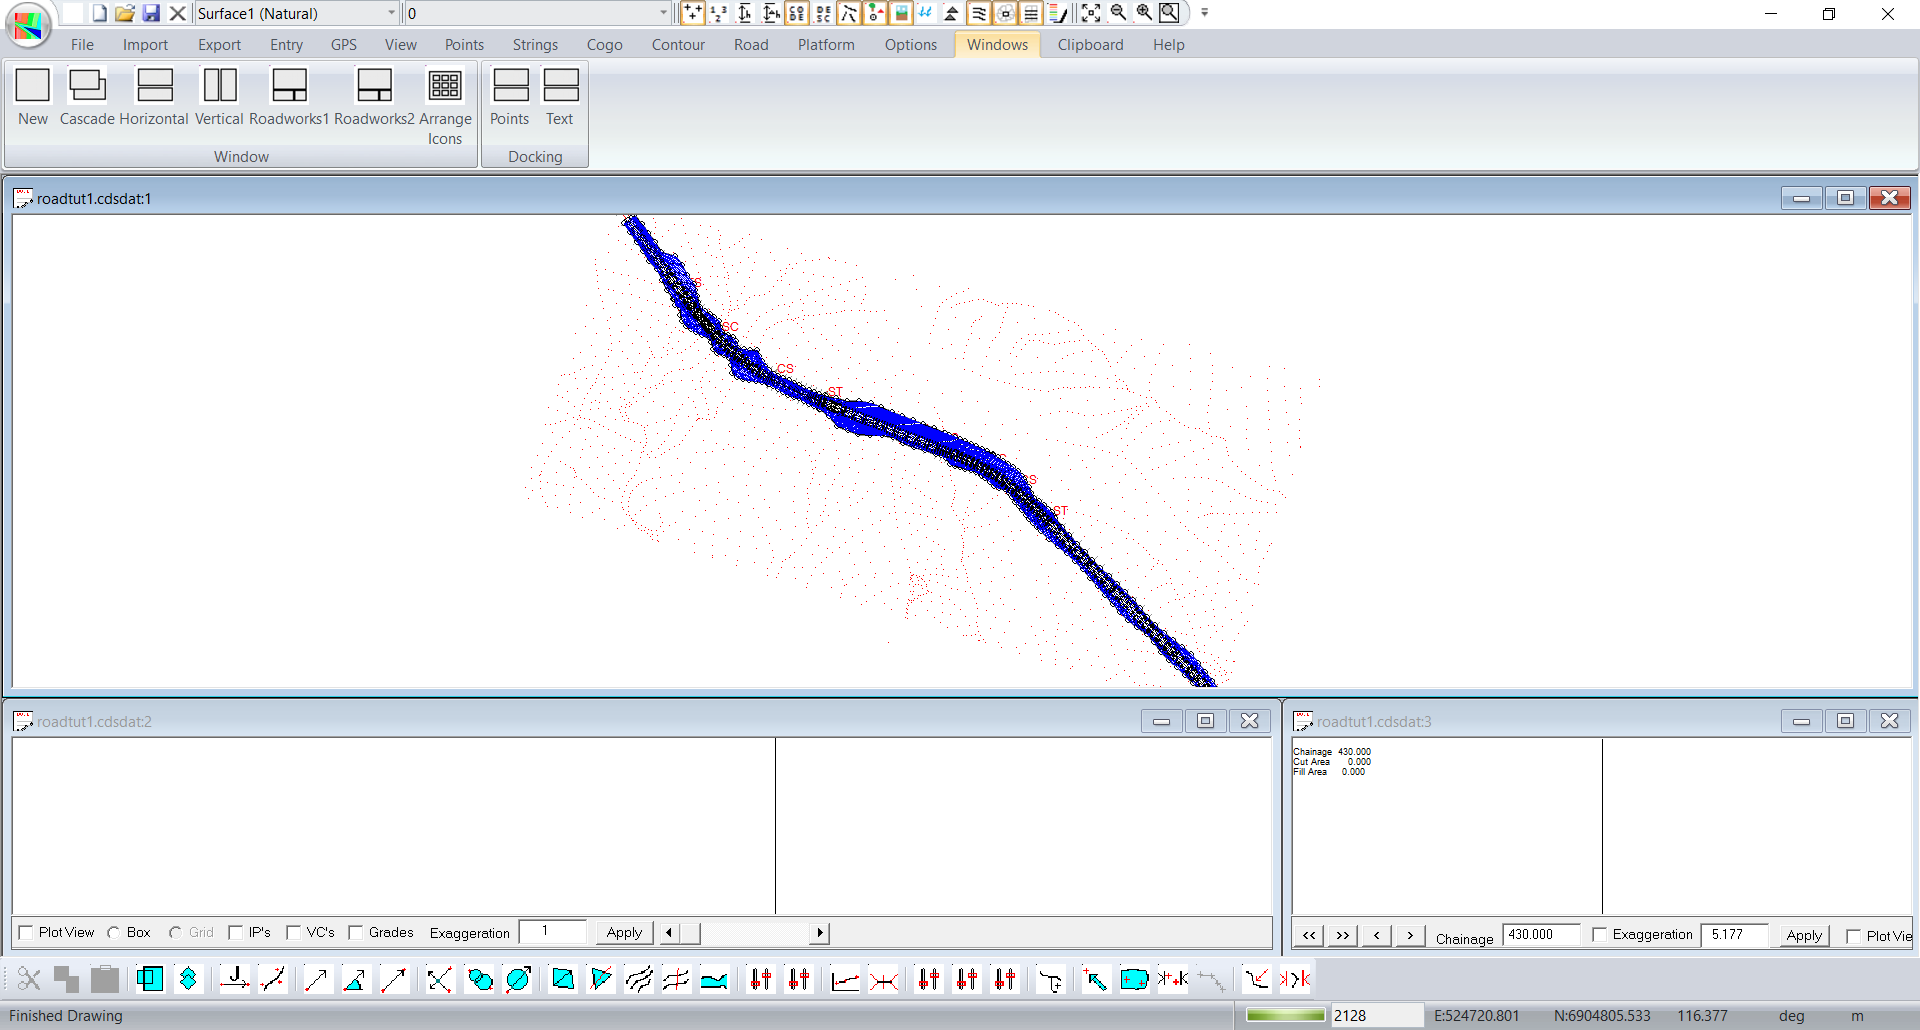
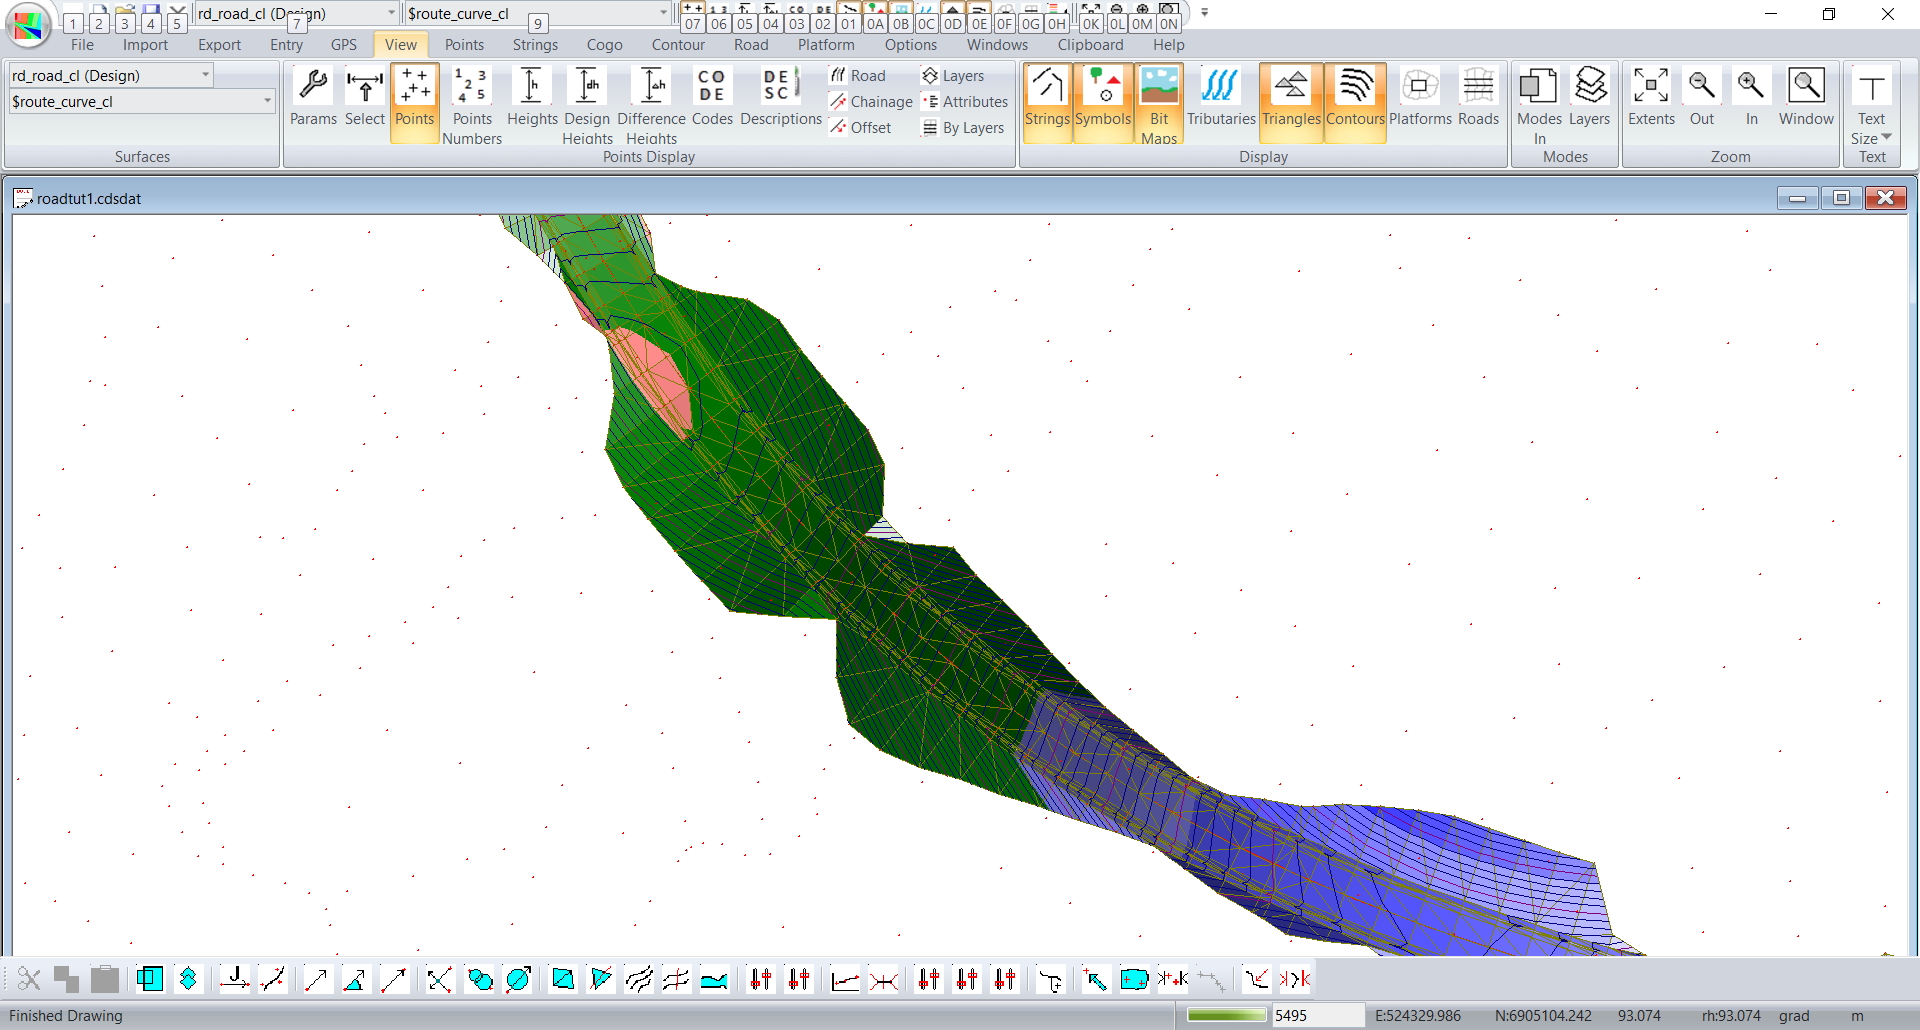
You have been given the topographic survey of the piece of land shown in CDS job 'roadtut1', and you are required to design a road through the property from the North West Corner to the South West corner.
You have formed a model and calculated contours and the job appears as below.
How you go about determining where to place the road is up to you, and is not important within this tutorial
Be aware that you can use the Contour, Interpolate functions to extract preliminary 'what if' profiles quickly and easily through the various routes you might wish to trial.
What it basically comes down to is you need to apply your experience, and any local constraints which may apply to arrive at a horizontal alignment for the road.
You may if you wish use external packages such as Autocad to 'draw' the proposed alignment, but we would recommend that you consider using some of the tools contained within the Cogo section of CDS, and we will use some of these to demonstrate their capability.
We warn you at this point that the alignment we use, and the designs we choose are not important, and certainly not recommended as sound practice. They are merely a vehicle for quickly showing you
a. the tools CDS provides
b. the general process which comprises the following broad steps.
The Process in General.
To design a new road across a 'Greenfield site' you need to use the following 10 Step Process, and then process to the very important 11th step where you get paid. If you persist to that level, you will even get to use an added bonus that you probably didn't know you had.
1. Define Horizontal Alignment - including Spiral Curves
2. Extract Profiles & Sections along alignment
3. Define Vertical Grading including Vertical Curves
4. Define Cross Section template, or templates
5. Position Templates
6. Apply Superelevation where necessary
7. Check Quantities
8. Repeat loop of steps 3 through 7 until you are satisfied with balance of cut/fill
9. Store Design Points in database - Form Design & Combined Surfaces
10. Plot Plans, Profiles & Sections - including quick & easy way to put chainages along the alignment plan.
11. Send Plans and Account to Client.
12. Added Free Bonus - 3D Views and 'Drive Down the Road"
1. Define Horizontal Alignment.
Use your own resources, experience and local knowledge to determine where the Alignment should be.
In this case you have carte blanch, with absolutely no constraints so anything is possible.
Here I have used Contour, Interpolate, Multi Profile a few times to 'look see' what a profile will be like on certain 'trial legs' of an alignment I have been thinking of.
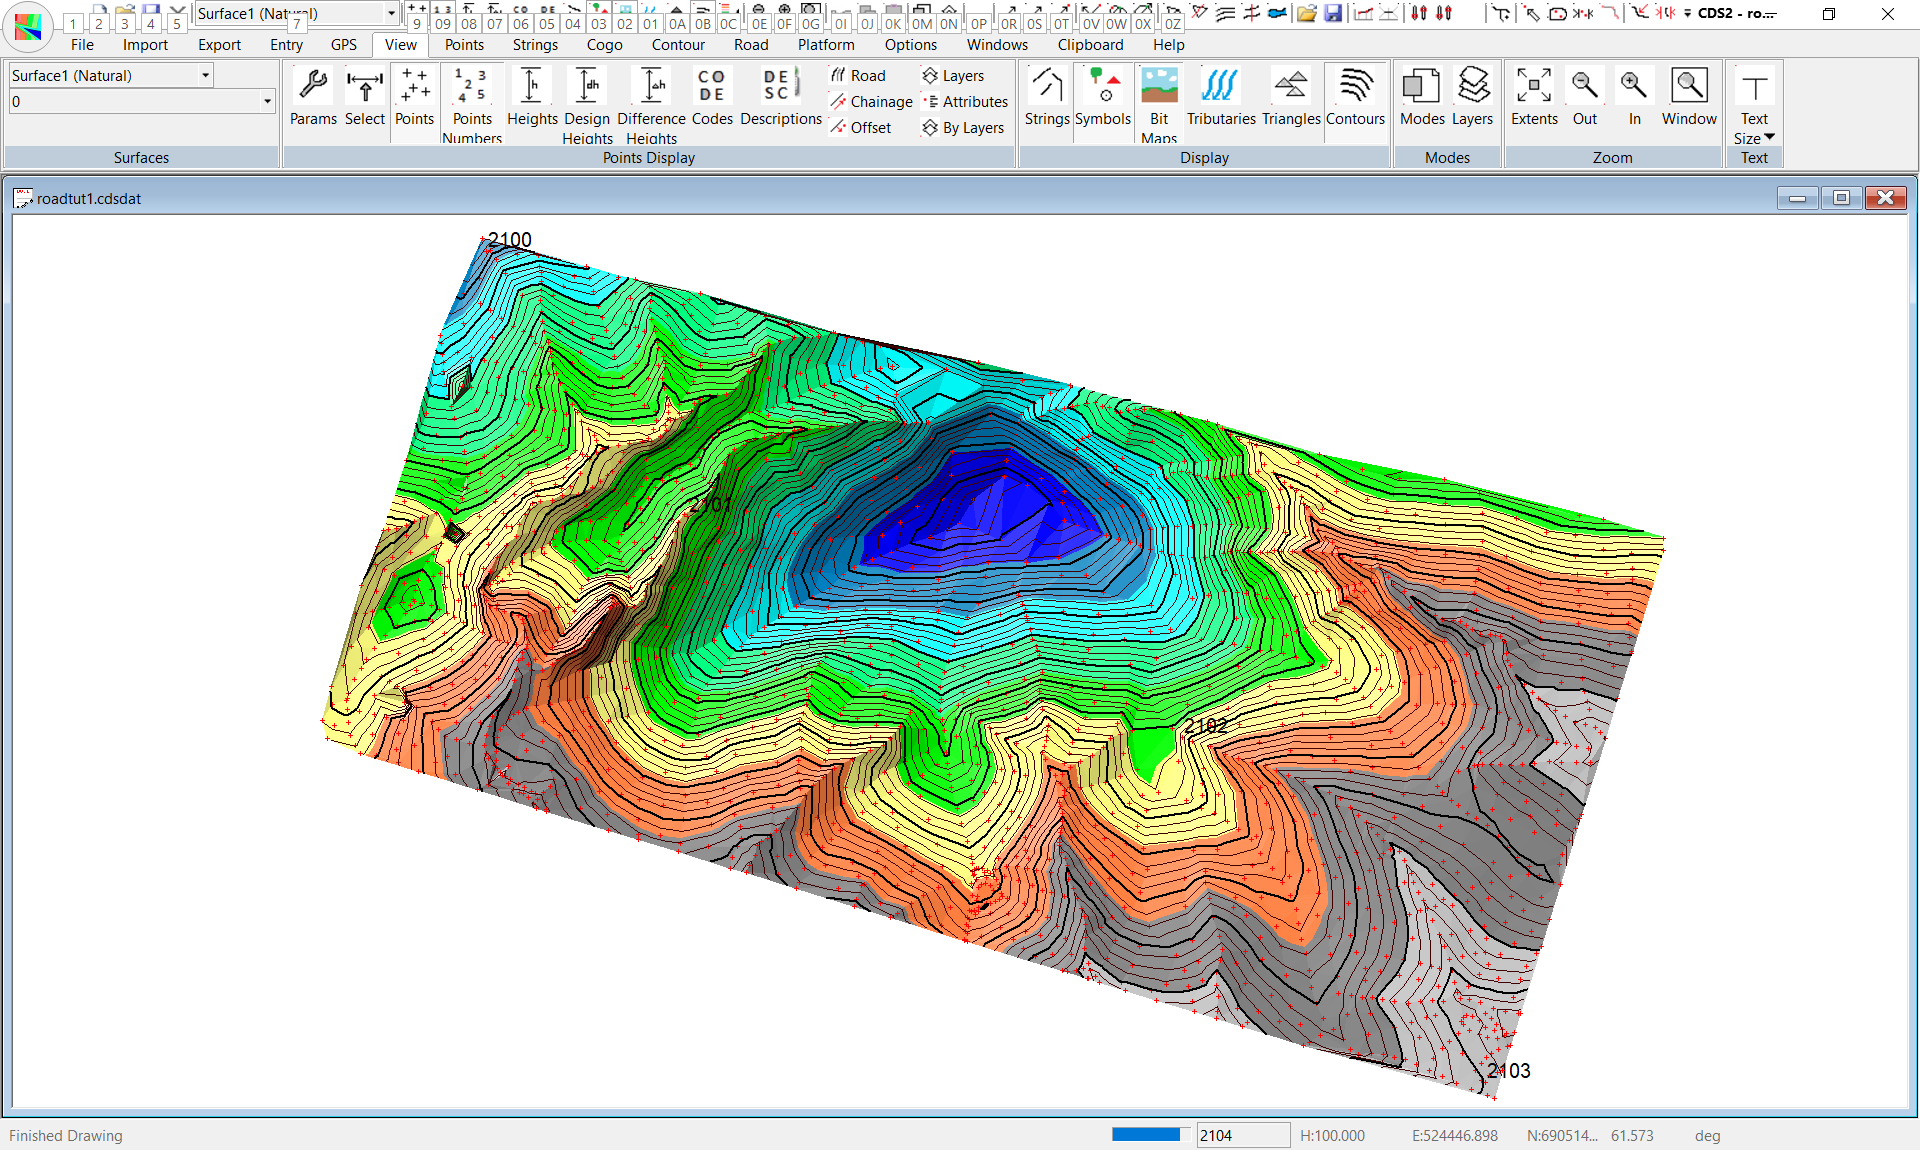
At the end of that, I will use Point, Add to 'click in' the Intersection Points (IP's) which define the straights of my proposed alignment.
Note: I start numbering the new Points from 2100 which is the next even hundred above the natural ground points, and I have put all the New points on a separate Layer called 'Frame'.
I then used Layers to turn off layer zero, and I can see the following screen.
Now that the broad 'framework' is established, I need to add in some curves at each of the intersection points.
I can use any of the Options found under Cogo, Curves, but the most efficient is this case is the one called Route Curve.
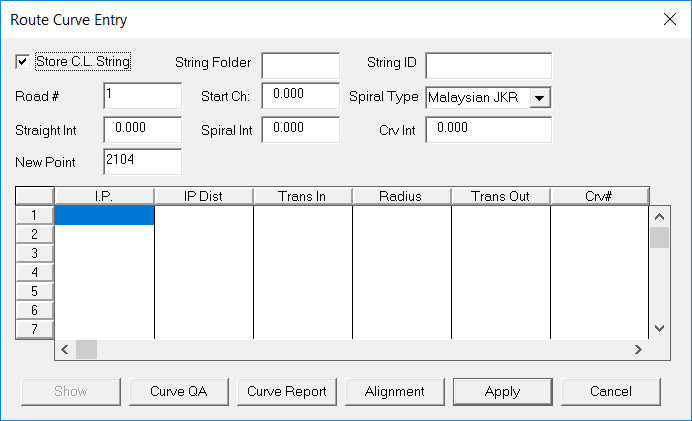
This allows me to define a 'table' of IP's then specify a curve radius and spiral/transition length required at each IP, and it will then calculate all the relevant points and store away the alignment string.
Make sure 'Store CL String ' is selected or ticked, then type in a folder and string Id for the centreline/alignment you are creating - here, allowing my creative imagination to run wild, I have used 'road' as the folder and 'cl' as the string id .
Leave the Road Number at 1, (unless you have already done a road 1 in the job)
The Start Chainage - can be left at zero here, but in real life you might be joining on to an existing road so you may have a real chainage to start with
The Spiral Type gives you a choice of Clothoid or Malaysian JKR ( the end result is for all practical purposes identical except in extreme circumstances)
The 'Int' in Straight, Curve and Spiral stands for Interval, and wants to calculate points at the intervals you specify along the alignment. You can choose whatever values you wish, but generally 50 metres on a straight, 10 metres on a spiral and 20 metes through the curve proper will provide reasonable data to allow you to produce an alignment plan annotated with chainages and the like.
If you do not wish to calculate points other than the main Tangent Points and Spiral Points, enter a 'large' interval which is longer than your total proposed alignment such as 9999.
Next you 'click in' the first field in the table, and enter in the point number of the first point in your proposed alignment - here it is number 500.
Press the Tab key and the cursor will move to the next line.
Enter in your next IP (here 501) and press Tab.
The Ip Distance column will be filled in to show you the distance between the two IP's you have specified.
Through some quirk of programming this total distance will also appear in the column titled Trans In, where it is more of a hindrance than a help (and will be replaced with a zero in future releases). If you wish to apply a Spiral/transition curve, enter the length of spiral you require here, and press the Tab key.
Then enter the Radius of the curve you want, Tab to the Trans out box and enter the length of transition exiting the curve (or use zero if you don't wish to use transitions).
You then fill in the rest of the table as seen below.
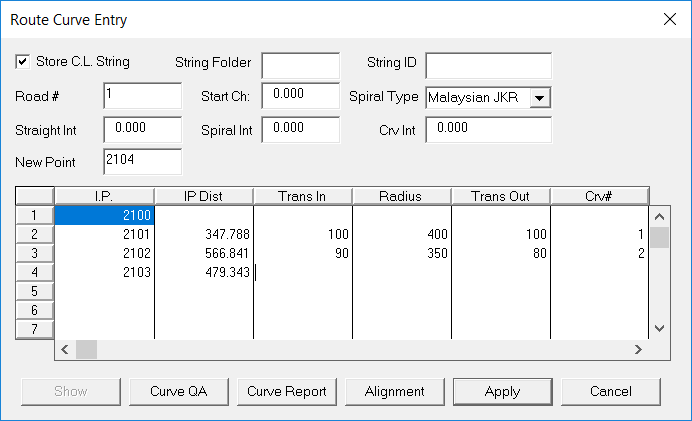
NOTE AGAIN - the values shown are neither recommended nor necessarily practically sane - merely an example to show you through the process, so feel free to use your own values.
When you select Apply, the points will be calculated and the string stored and you will see a screen similar to that below.
This is showing us the Point numbers of all points on layer Frame, but if you select the Layers command and set layer Frame to Display Codes , and turn off the contours you will see the following screen.
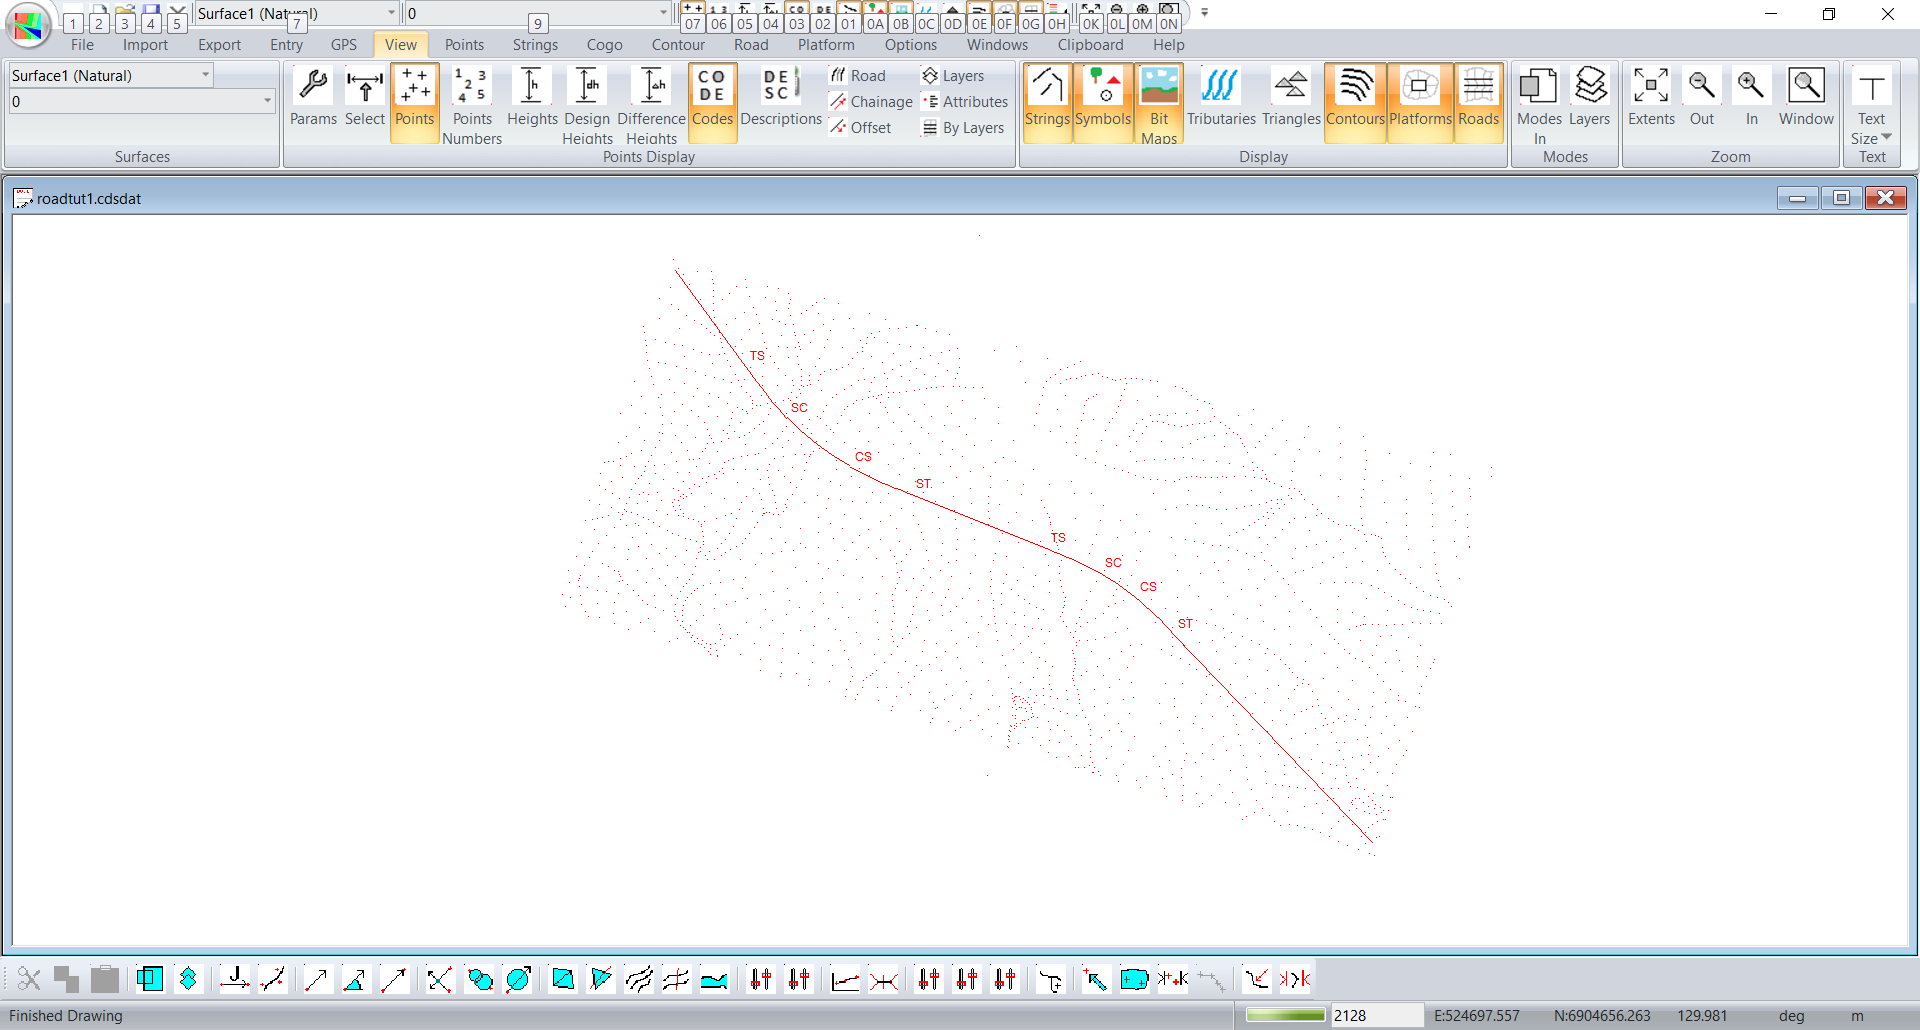
The terminology used is a 'standard' as anything else in the engineering world, which means that we thought it up when we needed it
TS - Tangent to Spiral
SC - Spiral to Curve
CS - Curve to Spiral
ST - Spiral to Tangent.
You should also be aware that a table of curve information has been created for each curve you specify and stored in plain text in files named "crv'x'.'job'", where 'x' is the curve number and 'job' is the current job Id.
The following is the information on Curve1.
SPIRAL N 6905010.266
CIRCULAR IP 2101
SPIRAL E 524435.989
DELTA 33°54'57" xs 89.886
Rc 400.000 ys 3.372
Ls 90.000 LT
Dc 14°19'26" ST
THETAs 6°26'45" Lc
PHIcDELTAc 0.3669 k 44.981
Ts 167.210 SE
Es
LC 160000.000
2. Extract Profiles & Sections
Now that you have an alignment string, you are read to Interpolate a Profile along it, and sections across it.
First use Strings, Select to select the centreline string.
Then use Contour, Interpolate, Profiles & Sections.
The following screen will appear.
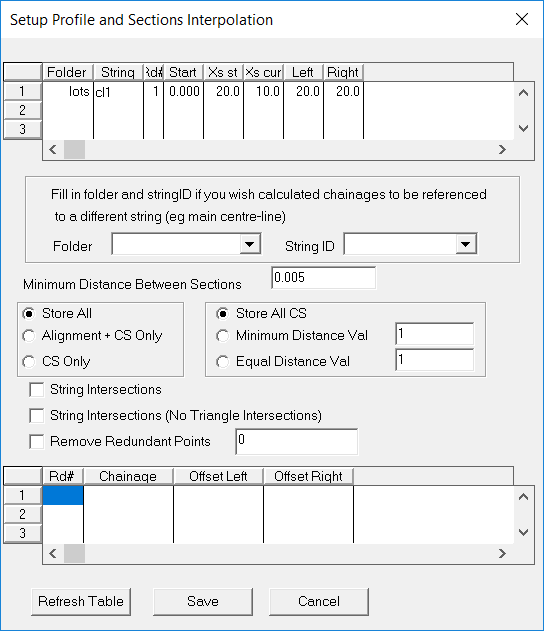
The program defaults to interpolating sections every 20 metres on straights, and every 10 metres around curves, and you can accept that, or change the values depending on your particular job.
It also defaults to taking the cross sections out a distance of 40 metres either side of the alignment. If you wish you can change those values as well.
Here we will just accept the default values.
Press the Refresh Table button.
CDS will then fill in the table with a list of all the cross sections it needs to interpolate along the route.
If you want, you can scroll down through them, and if you see any that you don't want saved for any reason you can highlight the particular line and delete it from the table.
When you are ready to proceed, Select the Save button.
A 'wait cursor' will appear and the programs will commence to interpolate as requested.
It does the Profile along the alignment first, and during this time you will only see a wait cursor.
It will then report at the bottom left of screen that the long section is done, and it will start counting through the sections as it process them.
Depending on the number of sections, and the size underlying model, this process can take a few minutes, so be patient, and don't start hitting keys and selecting things - at best it will slow the process down, and at worst it will stop it completely.
When the process is finished, the following screen will appear showing you 'thumbnails' of the profile and section. If you wish to look at the sections you can use the Next button to view them.
Note that the interpolated points will be stored on a layer which the program derives from the name of the alignment string. In this case you will see the name it is using is $road$cl. You can of course enter a name for yourself.
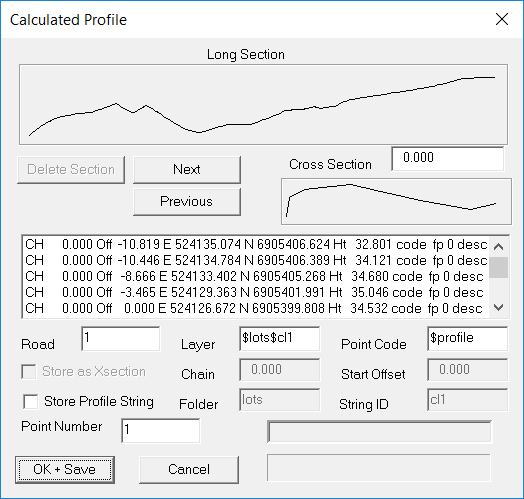
If everything appears to be OK, press the save button and the design will be saved. The data is associated with the centre line string.
3. Define Vertical Grading
If you are using road number 1, the program will automatically default to displaying it, and you should select
Road, Display & Plotting, Display Profile - a profile will fill the screen.
Now select Road, Display & Plotting, Display Section.
Next Select Window, Tile Roadworks, and the screen should appear as below.
You should notice that as you move the cursor in the Plan view window, it is 'tracked' by the vertical line in the profile window.
You can 'click' at a section in plan view and that section will be displayed in the section window.
We are now ready to 'grade the road' so maximise the profile window.
Note: if you wish to set the design line to be a different color to the reference profile use Road, Design Criteria, Profile Parameters and click on the 'Plot' button at the right of the design line to choose another color.
The menu options you need to work with profiles & sections are attached to the right mouse button, and when you press the right mouse button with the profile window active you will see the following 'menu window' pop up.
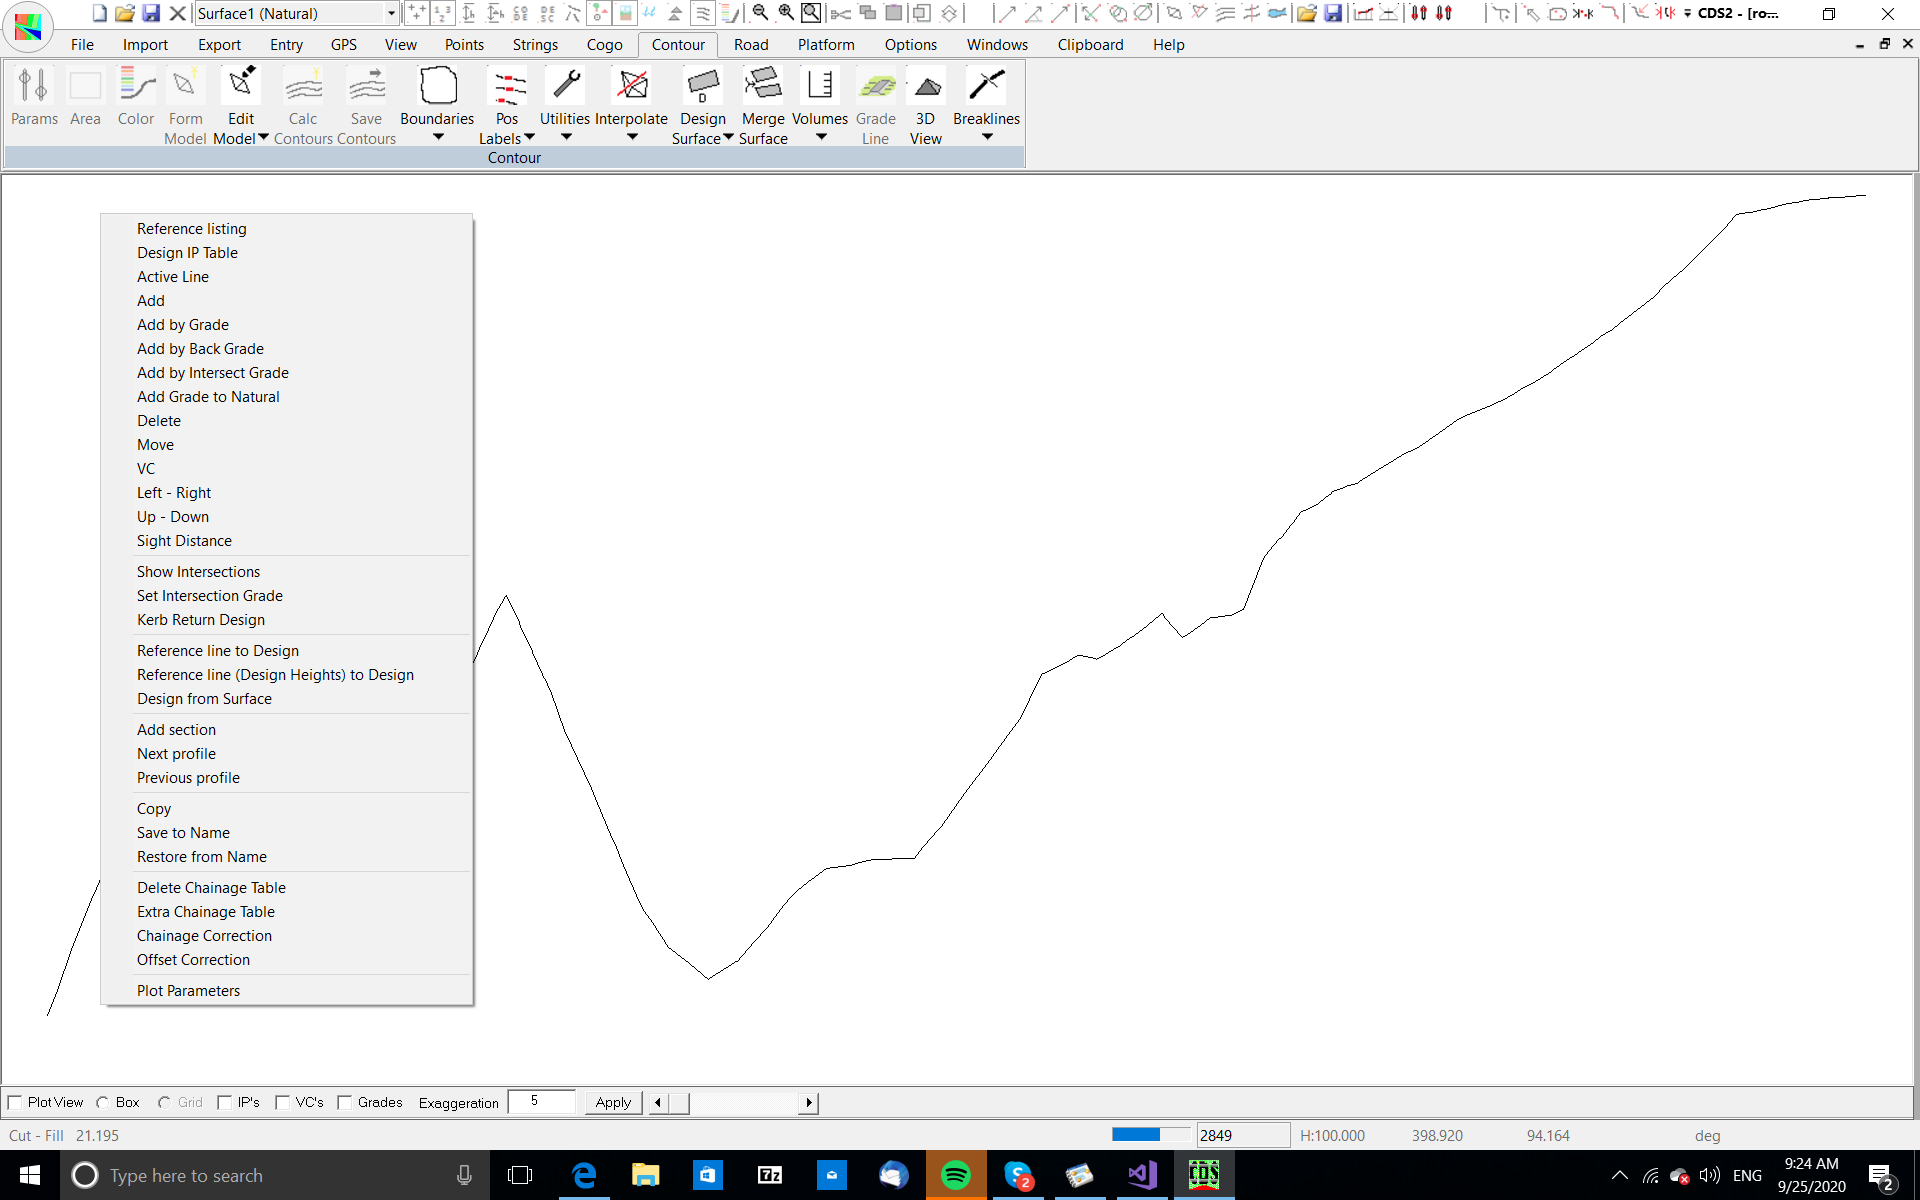
Select Add.
The grading process consists of adding in Vertical Intersection Points (VIP's) along the length of the route, and then placing vertical curves at the VIP's where they are required.
Position your cursor over the natural surface profile at the start and 'pick a point' by pressing the left mouse button
You will see a 'box' placed to indicate a VIP.
Now continue placing VIP's along the length of the road.
Note, you can 'eyeball' them and just 'Add' them in as you go, or you can use the various other options such as "Add by Grade" to position them precisely.
How you achieve the first 'framework' is up to you - read up in the On-Line manual about each of the tools and apply them in a manner which suits your personality, experience and project.
Once you have finished 'adding in' VIP's you can then fine tune by applying Vertical curves.
To do this use the right mouse button, select Vertical curve, and point your cursor in the box showing the VIP where you require the curve.
A table similar to the following will appear.
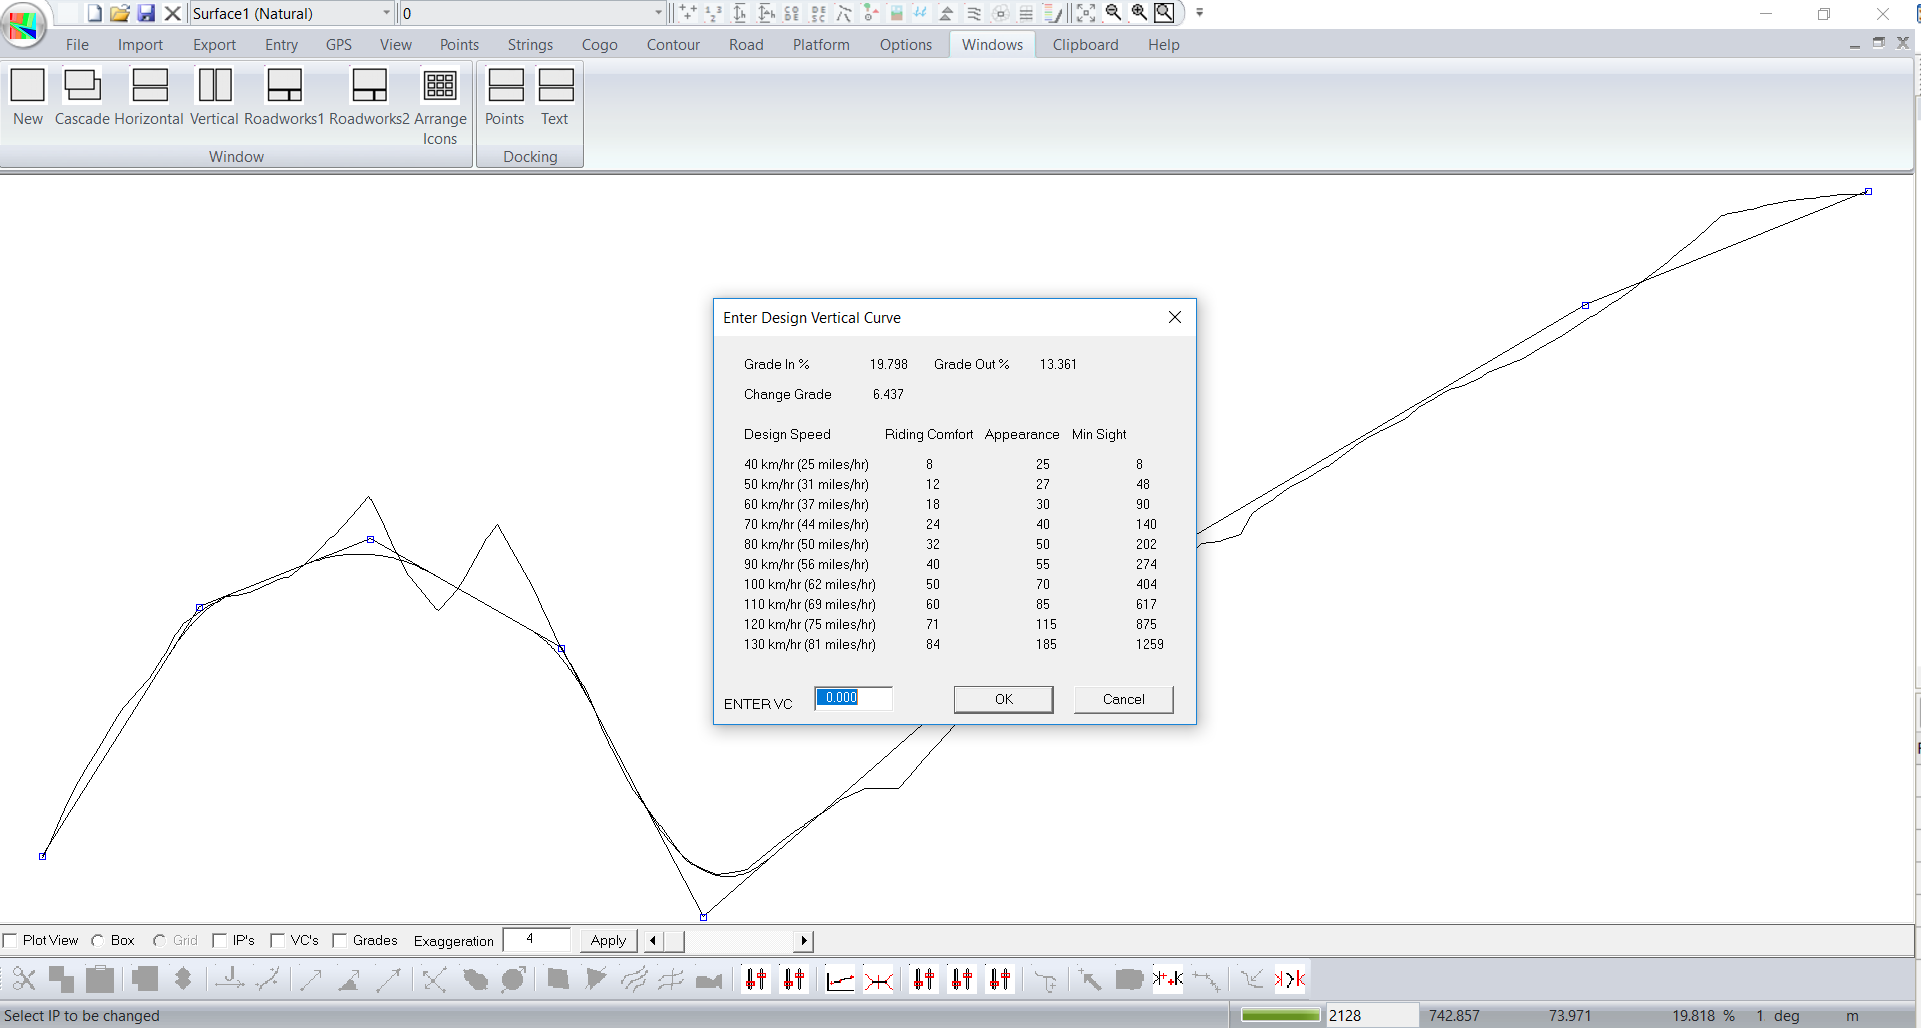
This gives a guide to the length of VC you need at the chosen VIP for various design considerations. Note that it is a guide only, and you can choose any length which you decide on.
You now continue to add VIP's and/or VC's, or move VIP's etc until you have a design which meets with your approval.
When you have finished designing your vertical grading, tile your profile window.
4. Define Cross Section Template, or templates
Next step is to decide what the design cross section, or sections should look like.
Since this is a theoretical exercise only and the numbers are irrelevant, I will work with a road which has 2 lanes each side of the centreline, each lane being 3 metres wide at a cross fall of -3%, then a shoulder of 1.5 metres at a cross fall of -4%, a gutter which is 0.5 metres wide falling at 1:4, or -25% and a kerb which is vertical for 0.2 There will be a 'path' of 1.5 metres wide sloping up at 4% behind the kerb and gutter and the section will then batter to the natural
Note that in CDS the 'template' you design consists of the 'right hand side' of the proposed cross section only, and you then mirror that about the centreline if required.
OK let's get started.
Maximise you Cross Section window and 'right click' to access the menu of options applicable to sections.
The screen should appear as below.
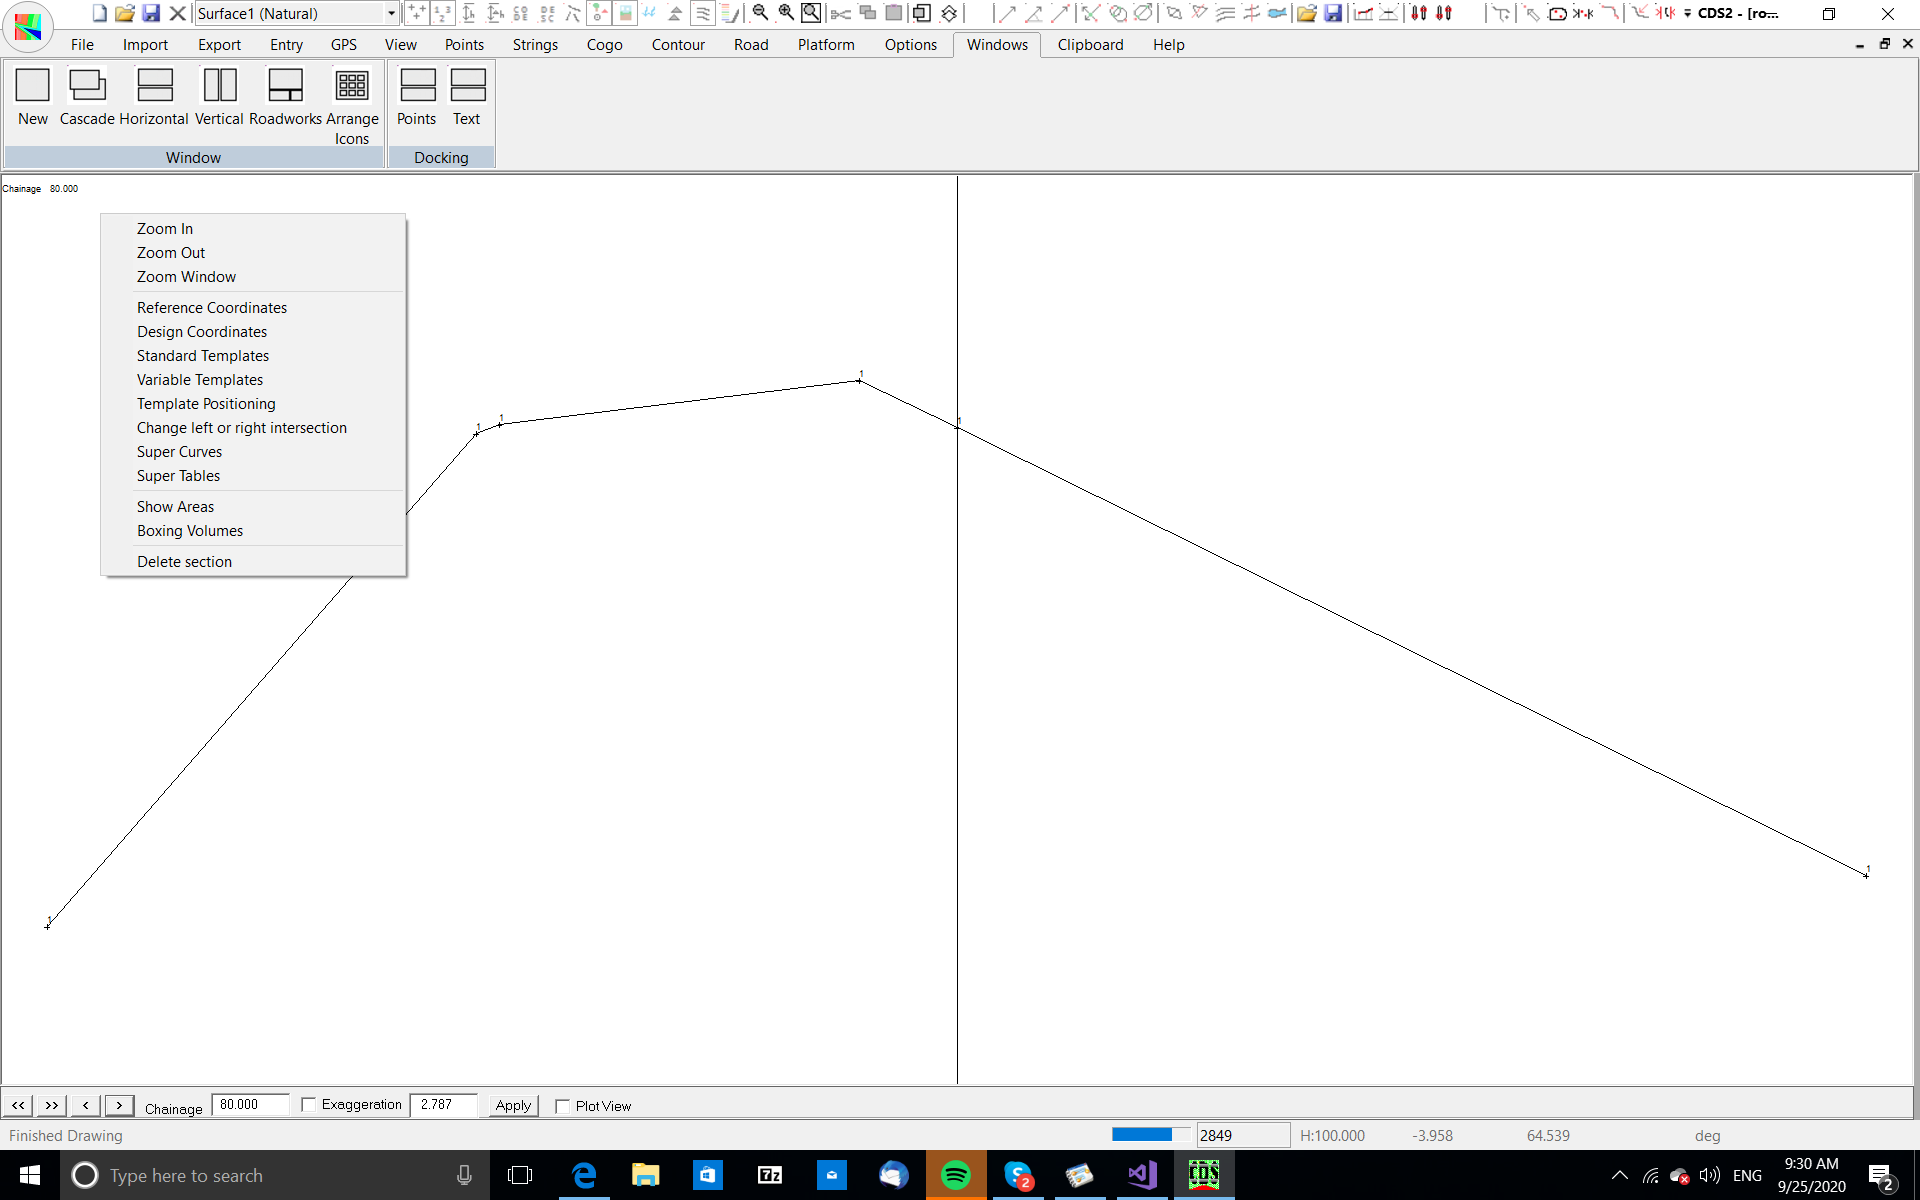
Select Standard Templates, and the following window will appear.
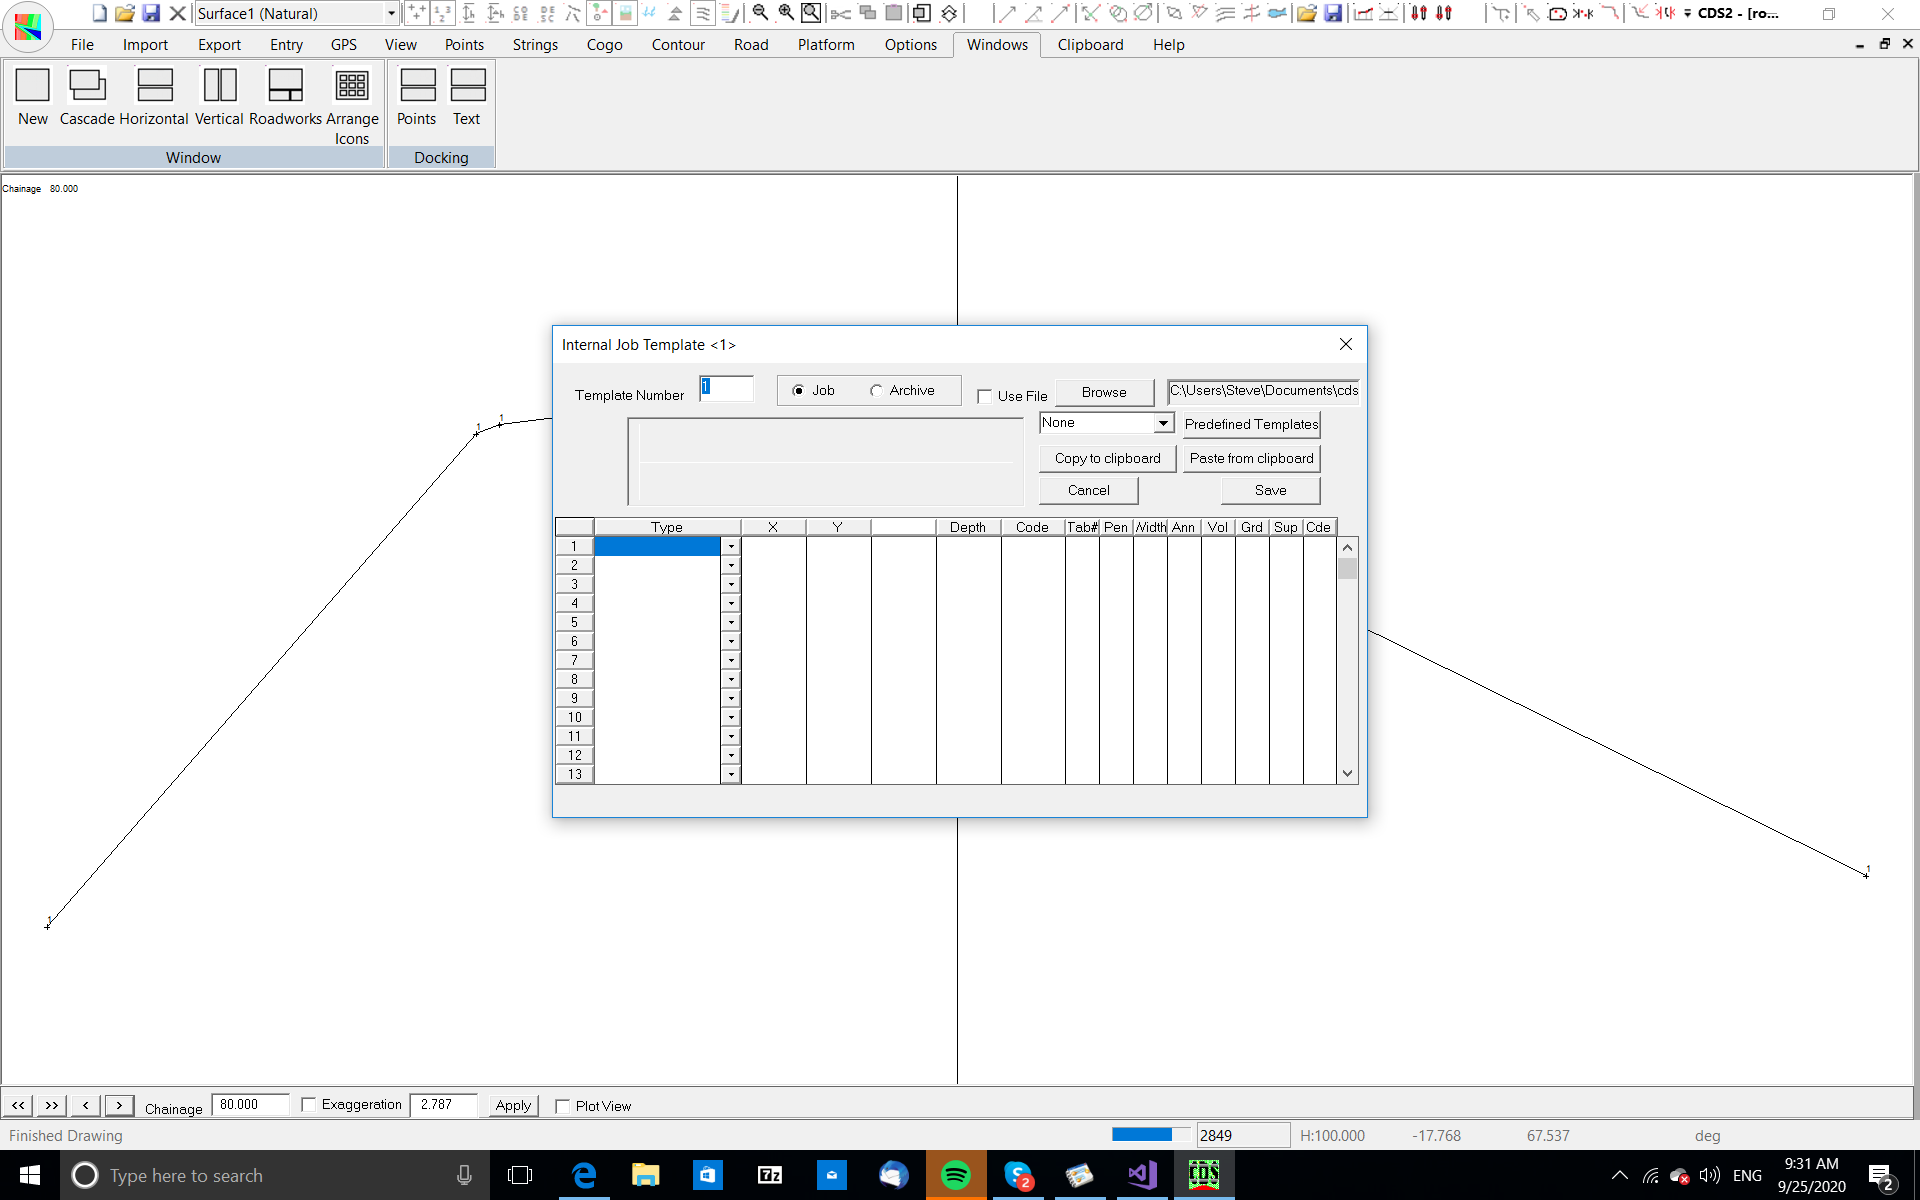
You will be designing a new template in the current Job, and a template number of 1 will be just fine, so move the cursor down to the first line in the table, and use the pull down arrow to see the types of entries you can have.
You need to tell the template where to start in relation to the design profile , and in this case it will hang onto the design line so use a Start , and enter values of 0 for both X and Y. Then press the Enter key to move across each of the other fields and come down to the second line.
Note: if you only wanted to draw your template to the top of the sub base material which was 0.3 below the final pavement, you could active this by starting your template at 0,-0.3 - i.e. 0.3 below the design grading.
Next you define the 'lanes' and you should use a 'Hdist & Grade'. The horizontal distance is 6 metres (2 lanes at 3 metres each) and the grade is -3. then press enter to complete the line and go to the next line.
Select another 'Hdist & grade' for the shoulder, and use a distance of 1.5 and a grade of -4 and enter until you get to the next line.
The gutter can be another 'Hdist and Grade' with 0.5 distance and -25% grade.
For the Kerb, choose "Goto Coords (Rel)". this cryptic shorthand indicates that you will instruct the template to move from the point it is at a distance in the 'X' direction and a distance in the 'Y' direction. i.e. the X and Y coordinates you enter will apply relative to the last point. So, select the type and give an X of 0.01 and a Y of 0.2
Note: we have set a layback of 10 millimetres on this kerb. If you wish to construct a 'vertical' kerb you should be aware that if you wish to contour the design surface later in the process, the contouring will not cope with a 'vertical' surface, so we suggest you use a 'layback' or 'X' distance of at least 5 millimetres.
Now for the 'path' use the Hdist of 1.5 and grade of 4% and finish off the line.
At this stage in the template, what you do next depends on whether the construction is in cut (i.e. below the natural surface) or in fill (i.e. above the natural surface).
Ezicad contains 'conditional' template statements that will react according to the conditions found.
So, let's test to see if the thing is in cut at this point.
From your pull down list select the Cut Condition. Enter a 0 in the >= column and 99 in the <= column to indicate that you want this to apply for 'any cut' or more precisely any amount of cut between zero and ninety nine metres in depth.
Then enter a 1 in the 'GoTo #' column.
This tells the template to measure the vertical depth of cut/fill at this point, and if it finds an amount of cut between zero and 99 metres to proceed down through the template to find a block marked Condition #1, and then act on the instructions found there.
If it finds any other value of cut, or any fill, it will simply look at the next line in the template.
Note: you can use this 'conditional branching' to set up different reactions for different depths of cut/fill. So for example for cut between 0 and 2 metres go to #1, for cut between 2 an 10 metres go to #2 and for cut greater than 10 metres go to #3.
Ok, we have established that if the template is not in cut (between 0 & 99), it will go on to do the next line in the template.
If it is not in 'cut' then it is most likely in fill, so then we can simply apply a fill batter as the next line. (The logic is not completely foolproof, but it will do for a start)
For Line 8 in the template choose 'Fill Batter at Grade" - enter a distance of 20. This indicates that you want the batter slope to continue until it hits the natural surface, or for a distance of 20 metres horizontally if it doesn't intersect with the natural.
Here we will use a batter slope of 1:2, 1 to 2 or 50% which are all the same thing expressed differently depending on which school you attended on which day. We don't care how you say it, but you can enter it as 1:2 or 50 and CDS will handle it.
This has reached a logical conclusion if the template is in fill.
Now time to create that Condition #1.
On Line 9 pull down and select Start Condition # and enter a number of 1.
If we are in cut, it is common to build a 'catch drain' at the foot of the batter, but since this is a 'broad brush' I will let you devise your own drains and just enter the batter slope.
On Line 10 select a Cut batter at Grade with a distance of 20 and a grade of 1:1.5 or one and a half to one.
The screen should now appear as seen below.
Select the Save button to save away your handiwork.
Note: the template is normally saved with the job, but if you wish to use this template as a 'standard' template, you can copy it to the clipboard, switch to Archive templates, and paste it there.
You can then retrieve it from the archive and past it into new jobs where it is required.
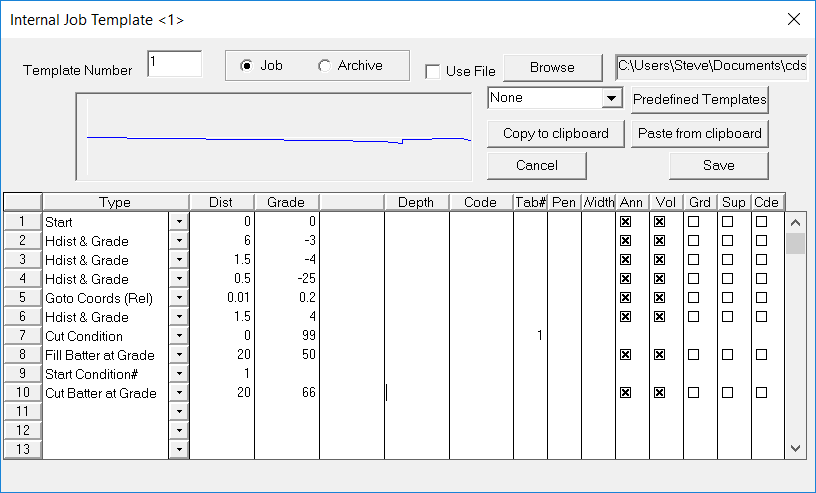
5. Position Templates
Now we need to tell CDS where to use the template we have just created.
Right click to call up the Options menu again and the following screen will appear.
You will see all the cross sections are listed, and you have two columns headed '1L' and '1R'.
This indicates you have design line 1 turned On, and CDS is asking you to tell it which template you want to use to the Left of the line and to the Right of the line.
Here we will use Template 1 on both sides, so enter 1 in both columns at chainage 0.
Then 'Right Click' on the 1 in both columns at chainage zero to copy that value down through the column.
CDS will tell you it is globally changing the following chainages, so click the OK button to humor it.
Once you have done both columns you should select the Save button. CDS will show in plan view the design extents with contours etc.
If you now use the horizontal scroll arrows, or the Next button to scroll through the sections you will see that the design template is applied, and the sections drawn and 'colored in'.
If the design is in fill it means it is above the natural surface which is normally towards the sky which is usually blue so areas of fill are colored blue.
Using a similar twisted piece of reasoning, if the area is in cut it is below the natural surface which is normally dirt which is a yellow/brown color hence the large bits of yellow.
Below you will see Chainage 140.
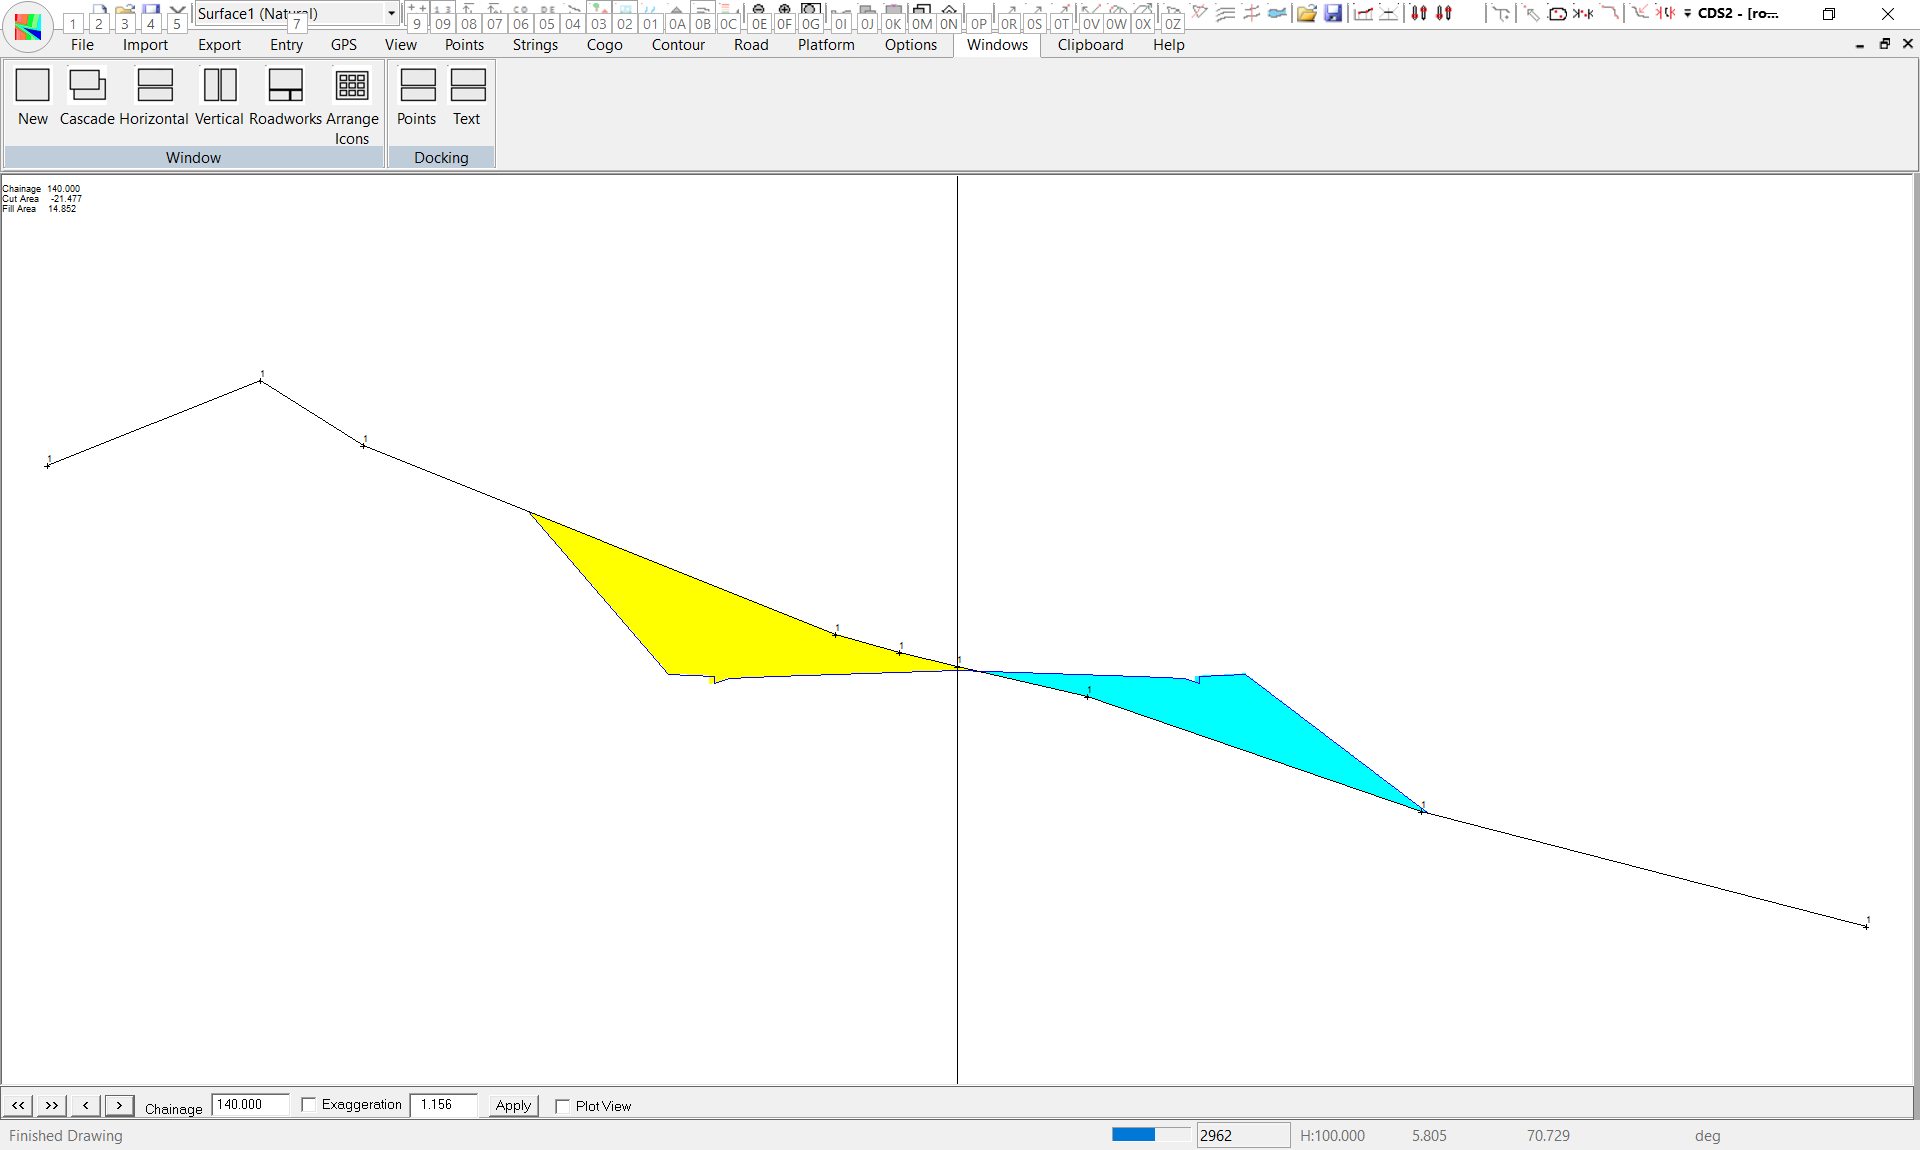
At this stage I strongly recommend that you scroll all the way through the job and 'eyeball' each section quickly before you go any further.
If you see a section where the design falls outside the natural surface section it is a reasonable indication that you have too much cut or fill on the centreline, and you should probably adjust your design grading before you go much further.
If you wish here you can flip between the profile window and the section window, moving the VIP's or changing VC's until you are happier with the outcome on the section side of things.
Or, in real life you may change the batter slopes of your template or any one of a combination of things. Some changes show up in the plan view automatically. Others don't automatically as they are resource intensive and can slow down the software. In this case click on Drain -> Recalculate to redraw.
Whatever you choose to do, I strongly recommend that you get the thing vaguely right at this point before you worry too much about applying superelevation.
Note: if you are designing in real life, it is not uncommon the have bridges in the road. Obviously if a bridge is going to be placed, you do not want your templates to extend through that region. You can block out the templates by going back to template positioning and suing a value of -1 at the sections where the bridge will be.
6. Apply Superelevation where necessary.
Once the design is roughly correct you can look at fine-tuning by applying superelevation.
The first thing to understand and remember is that in CDS the horizontal alignment and the spirals/transition are NOT linked in any way to the application of superelevation.
To apply 'super' in CDS, you use a 'tabular method' which we have adapted from manual practices we found used by a number of design authorities.
This involves specifying the chainages where you want to start applying super, and which table you wish to use.
First let's look at the tables.
6a Super Tables
Select Road -> Design Criteria -> Edit Super Tables and enter table number 3 and you will see a screen similar to that below.
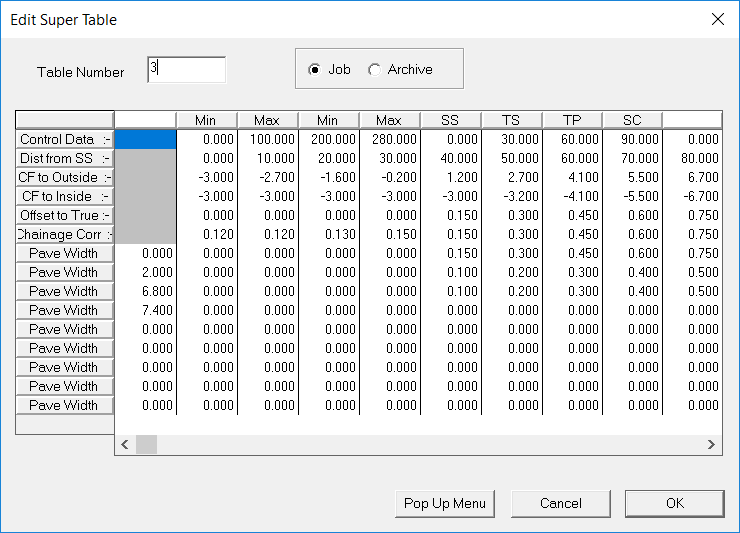
Don't be alarmed at the amount of stuff in the table, once you get the hang of it is quite simple.
First of all disregard the first line - it just contains information copied from the manual tables previously in use and now largely redundant.
If you look at the second line titled Distance from SS, you will see that it extends from 0 to 90 in a 10 metre interval.
SS stands for Start of Super
If you look at the next two lines you have Crossfall to Outside and Crossfall to Inside.
You will see that at a distance of 0 you have crossfall inside and outside of -3%. Now move to the right until you see the distance of 90 from the SS, and here you will see that you have a road with a side fall of 7%. The columns in between simply define how this full super is developed over the 90 metre length.
So, this table can be used for any curve where the crossfall throughout the curve proper will be 7%, and you wish to ramp it on over a length of 90 metres.
By using this table you can specify exactly how the superelevation is applied through the transition - you simply specify what grade, side slope of crossfall you want on each side of the road at each 10 metre interval through the superelevation transition.
The tables we have supplied are as follows.
Table. 'Transition' Length Max. Crossfall
1 70 7%
2 70 7%
3 90 7%
4 110 7%
5 110 6%
6 90 5%
7 90 4%
8 90 3%
There are more details of the application of these tables in the On Line manual
If you are not happy with the results of these tables, enter your own values, or create other tables to use as you please.
Important NOTE: these tables, in their native format were also used to 'offset' the cross section to create the effect of a horizontal spiral curve.
In the days before computers this made it easier, because the surveyor would peg the 'true' centreline' which was the line calculated with only the circular curve, and then the construction crew would simply offset the specified amount at each chainage when they came to build the road.
If you have already incorporated spirals in your horizontal design alignment, you should 'zero' the line in the table labeled 'Offset to True' .
In table 3 for example, you will see that the offset to true starts at 0 and increased to a maximum of 0.9 at 90 metres.
Simply go across the line and enter zero in each field.
For the purposes of this exercise, and many others, the values you find in the tables will be just fine.
Other designers may choose to use a different rate of application to ramp on the super.
Doesn't matter what you want to do. If you set up a table, or a number of different tables for different lengths of transition, and different final amounts of superelevation you can then save them away and use them over and over.
Ok, lets accept that the tables will work and see how to apply them.
6b Specify Curves.
The specify curves option does NOT yet understand an alignment string which has a spiral or transition curve in it - it was designed to work with strings with circular curves only.
If you have already specified spirals, as we have done here, then you must obtain the chainages of the start and end of curves, i.e. the TS and ST Points.
Here are the values I have used - yours may be different
TS1 283.968
ST1 610.746
TS2 780.000
ST2 1099.173
You then specify the Super Table you wish to use. The number is positive for a Right hand curve and negative for a Left Hand curve.
So, here Curve 1 will have its table entered as -3 and Curve 2 will be 3.
OK, select Road, Design Criteria, Superelevation, Specify Curves.
The Curve Table will appear, and you should enter the values as above.
The screen will appear as below.
Next you should position the section view to the centre of the curves to check that the design section is now superelevated as required.
Below you can see the section at Ch 350, and it is clear that the 'super' is taking effect as desired.
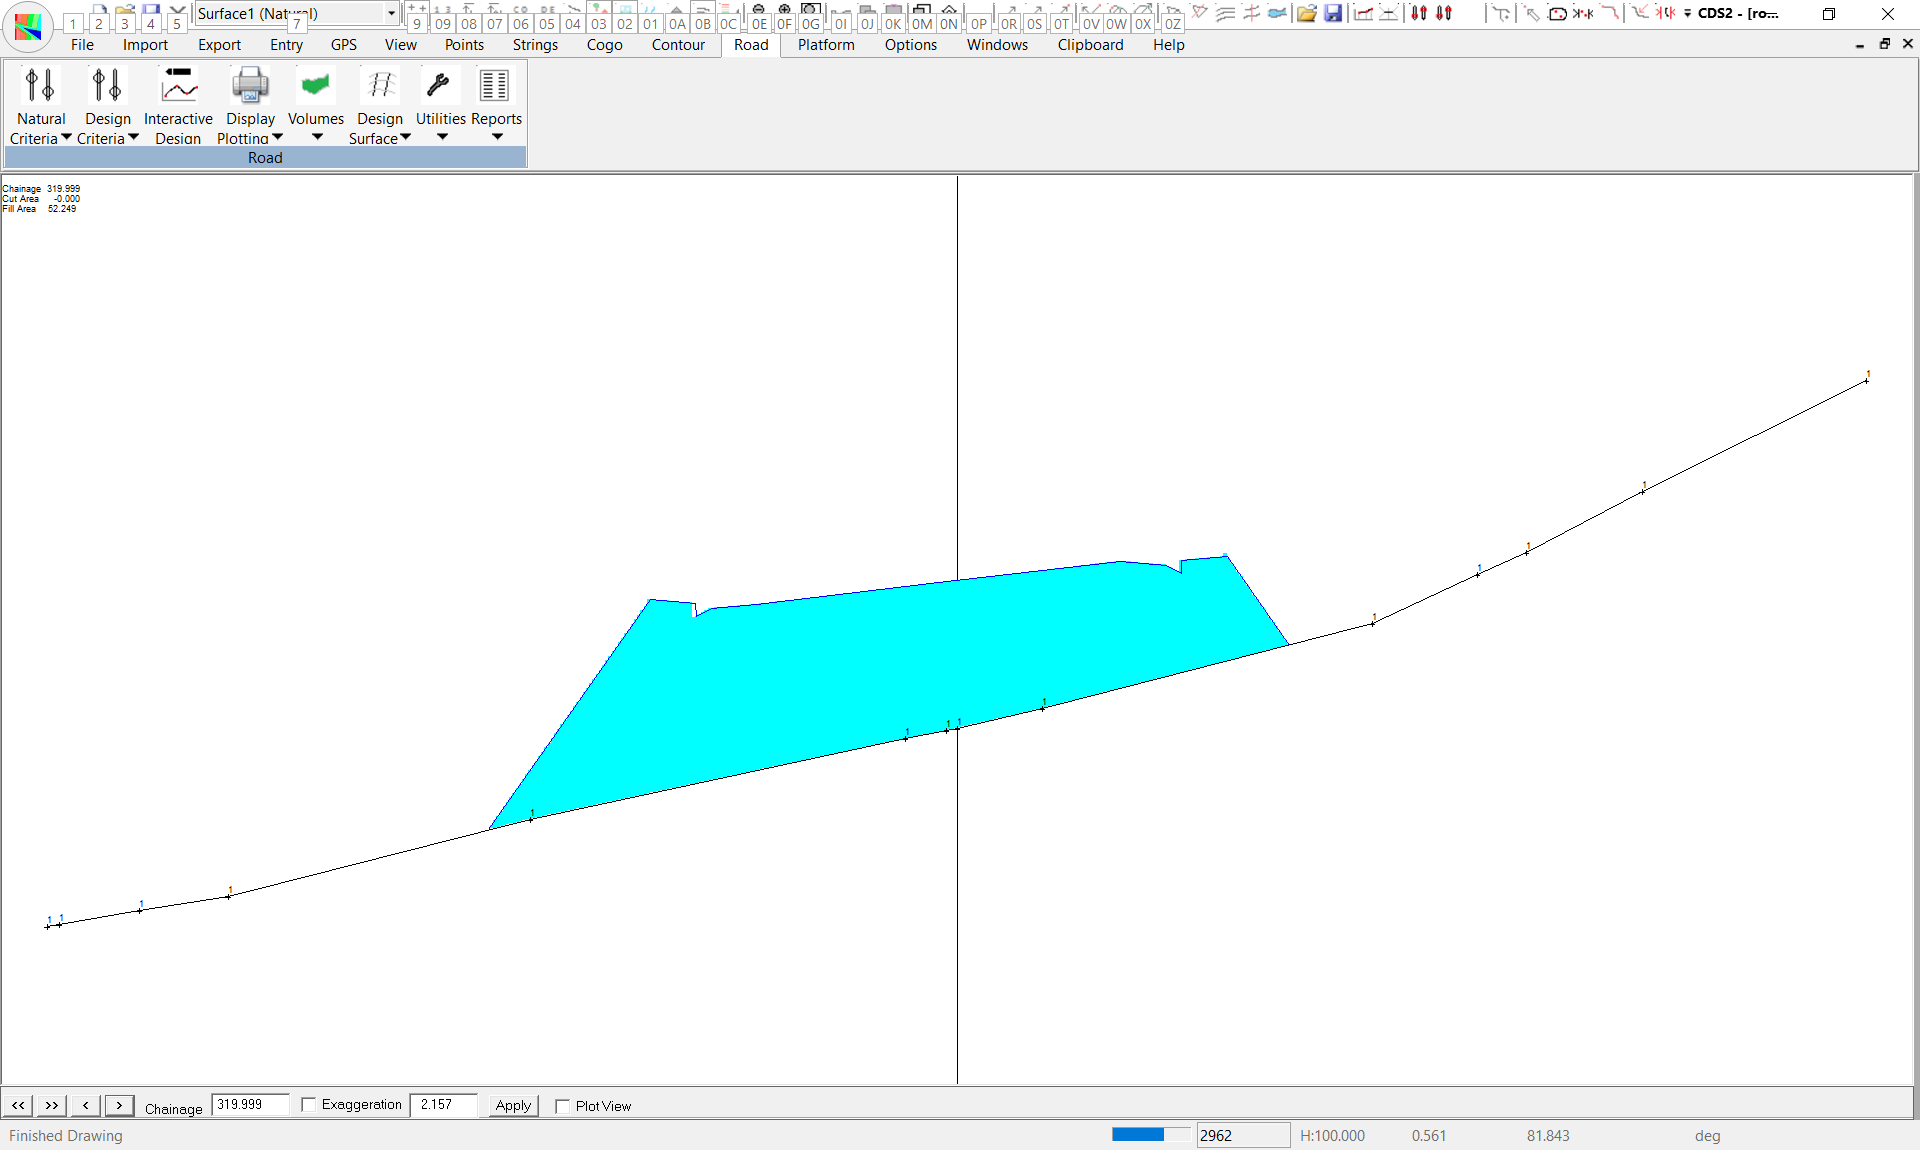
I leave it for you to check through the remainder.
7. Check Quantities.
Use Road, Volumes , Design Volume parameters to set up the range of chainages to use, the format of the output, and whether you wish to calculate stripping of topsoil.
Once you have set up the parameters, run Road, Volumes, Design Volumes to see the report of the quantities your design will produce.
8. Design Iterations
Repeat loop of steps 3 through 7 until you are satisfied with the balance of earthwork quantities.
9. Create Design Surface.
You should be aware that CDS does not automatically store the design away. What is shown in the plan view is generated as we go.
The sections you see are generated 'on the fly' from the design profile and template information, and no individual points are stored. until you choose to store them.
To store the design DTM click on Road -> Merge Road.
We have the following dialog and we are asked for a start point number and whether to create strings.
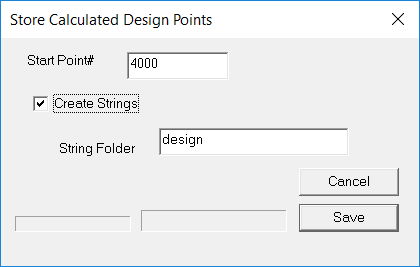
Clicking Save creates the new surface incorporating the design. Something like this:
To unsave the design go to Road menu and unmerge. You can then modify the design as necessary and remerge the road design as necessary.
Create a Model of the Proposed Road.
If you wish, you can easily create a model and contour plan of the proposed road design.
First, use Contour, Surface Parameters to Add a new surface and make it a Combined Surface.
Then Select Road, Design Surface, Create Combined Surface.
A small window should appear suggesting that the Base Surface is 1, the Overlay Surface is 2 and the Combined Surface is 3, which is exactly what we want, so select OK, and wait while the program goes about the task.
You will see numbers ticking over in the bottom left hand corner of the screen as the process takes place, and you should refrain from pressing keys or clicking the mouse until the small "Merge" window disappears and you see a new triangulated model appear on the screen.
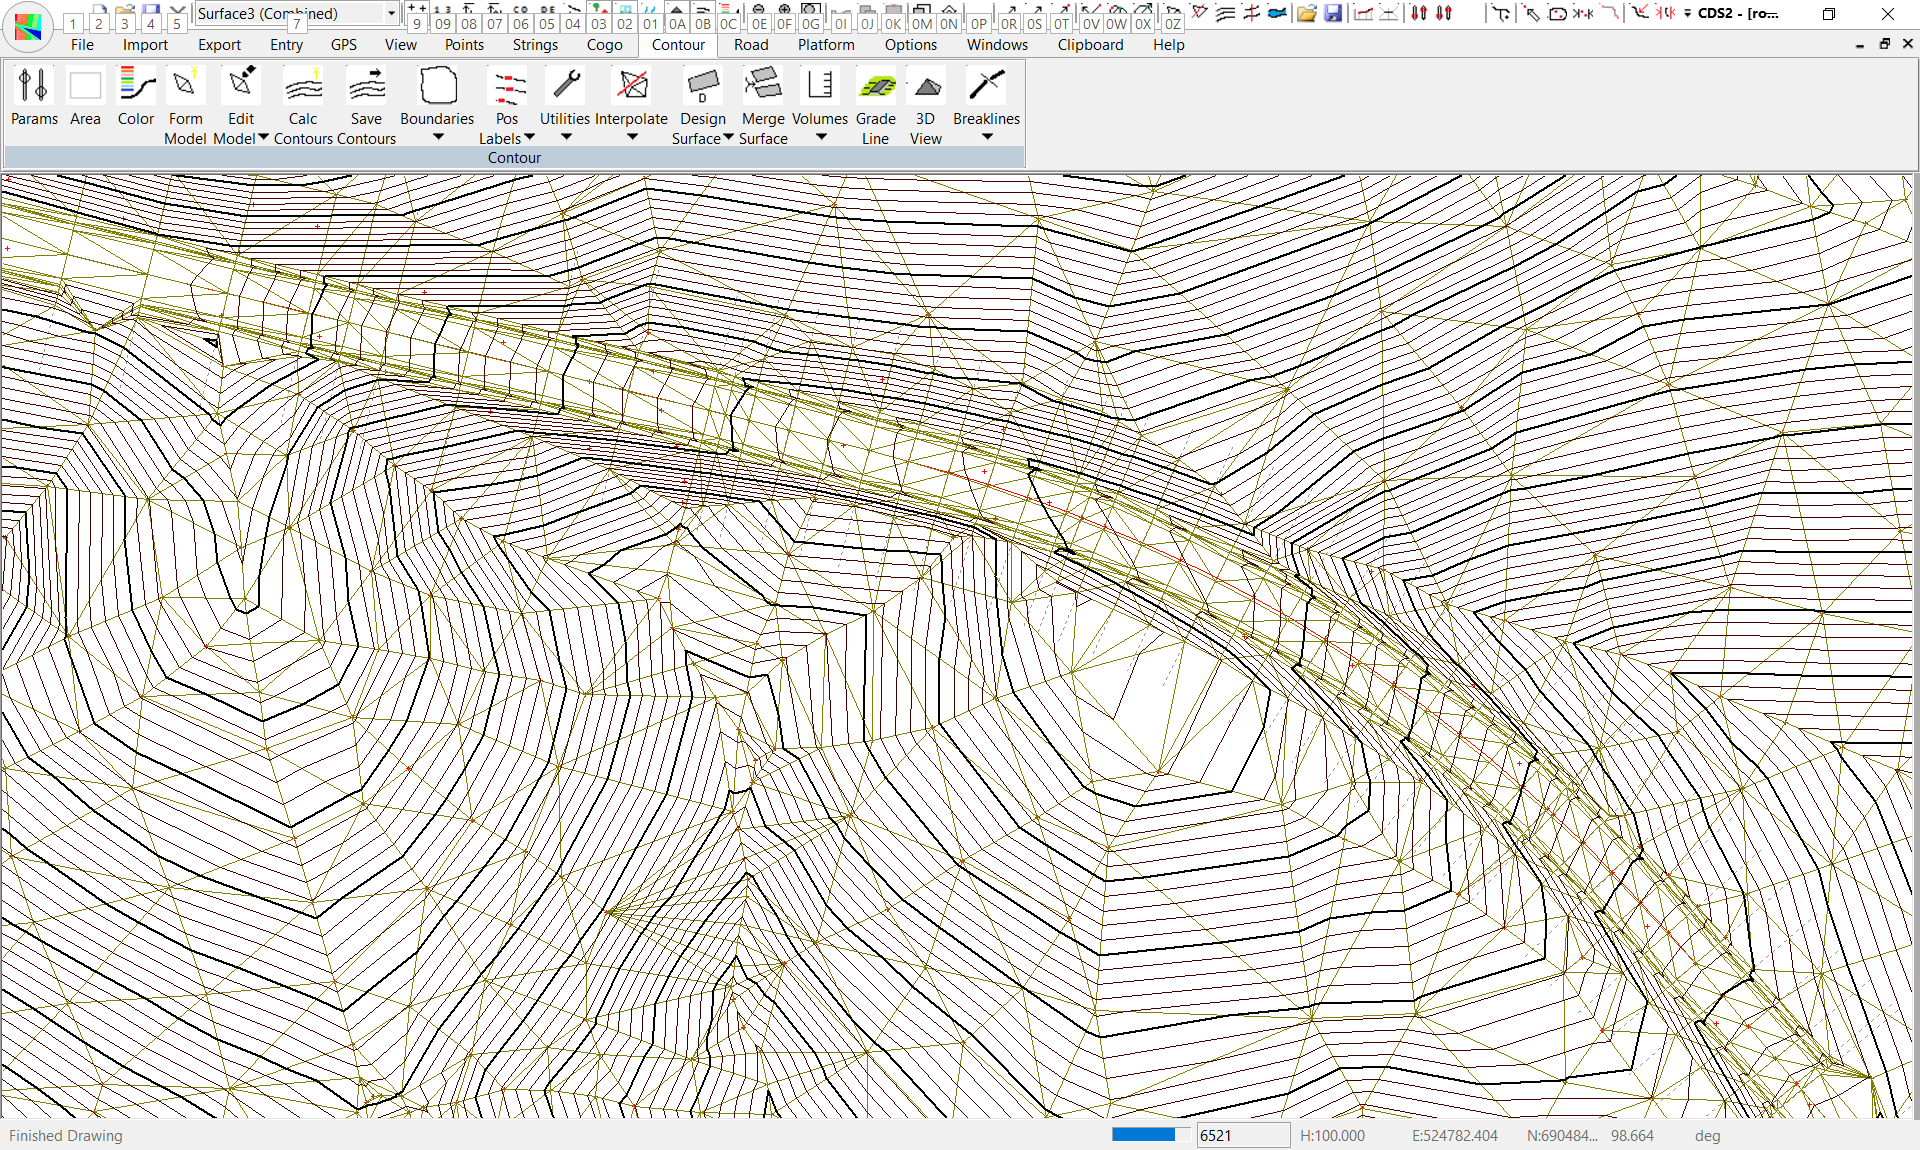
If you Calculate Contours, then turn off the triangles, you should see a screen that is similar to the one below.
10. Plot Plans
It is difficult to predict what combination of plans will be required, because every designer, and every client has different requirements, so we leave you to look at other tutorials where details are given on how to plot profiles, sections and plans.
Note, it is common to wish to plot out the centreline with the chainages along it and the other design strings.
To achieve this you need to create 2 or more 'classes' of strings so that you can tell one class just to plot the string, and the other class to annotate the string with the chainage.
If you just try and turn on the chainages, it will plot chainages on all the strings it plots which will create an unsightly mess.
Select Strings, Change.
Use the pull down capabilities to select the folder with your design strings - "Design1 in my job" - and then pull down to select the string that represents the centreline - "line6" from my templates.
Then type in a 'class' of 'centre' or whatever name you choose, and then select Finish to save the changes.
Now select Strings, String Attributes.
You should see 2 'classes' listed in the table at top.
Highlight the class named 'centre'
Now 'tick the box' for 'Chain (HAO)". This cryptic message indicates that you want to plot Chainages at the Half Angle Offset to the string.
You might also look at the field in the 'Acc.' column. Here you should set the plotting Accuracy to 0.01 to have the chainages displayed and plotted to the nearest 10 millimetres.
Obviously you can plot them to the millimetre if you wish, but if you do, it can mislead some poor fool into trying to work to that level of accuracy, which, in practical terms in the field is impossible.
11. Send Plans and Account to Client.
Probably the most important step in the process, particularly from your bank manager's point of view, so do it early, and do it often..
|