| < Previous page | Next page > |
|
Volumes from Sections and Progress Volumes
In this tutorial you will;
Entering the Data
You have been supplied with two sheets of levels.
The first one at January 30 are the sections after preliminary stripping, but before construction proper starts.
Click here to display/print the data.
The second set of levels was taken at the end of February, and the contractor has asked you to calculate the volumes of dirt moved so he can present a claim for progress payment.
You should use the techniques which you have already learnt in Tutorial 5 to use Entry of Reduced Levels to enter the January levels as Road 1, and save them as Level Sheet 1.
Next you should again start the entry routines and enter the February levels as Road 2, and save them as Level Sheet 2.
Note that you should start point numbering for the February levels from point 100 to ensure unique point numbers for each section.
If you are at all unsure as to how to go about this process please take some time to re-do, or at least re-read Tutorial 5 which will tell you everything you need to know to complete this task.
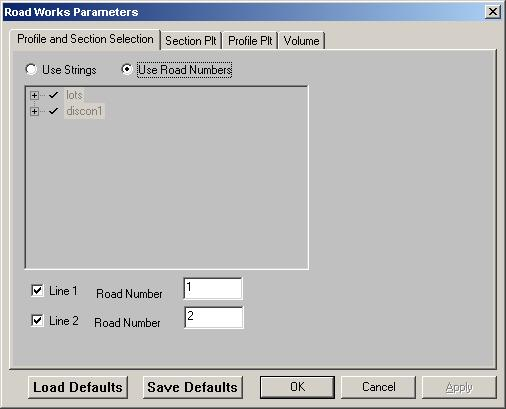
Once both level sheets have been entered you should store them in a job called EX7 in the tutor folder. Next you should use File Open to open the job db.ex7 and then select the Road option.
The screen should appear as seen at left. You will again note that the points have defaulted to be displayed horizontally across the page; as we have no way of knowing there true orientation.
Define & Display Profiles
Display Sections and Profiles
The screen should now appear as below, showing you the profiles and the two cross sections at chainage zero.
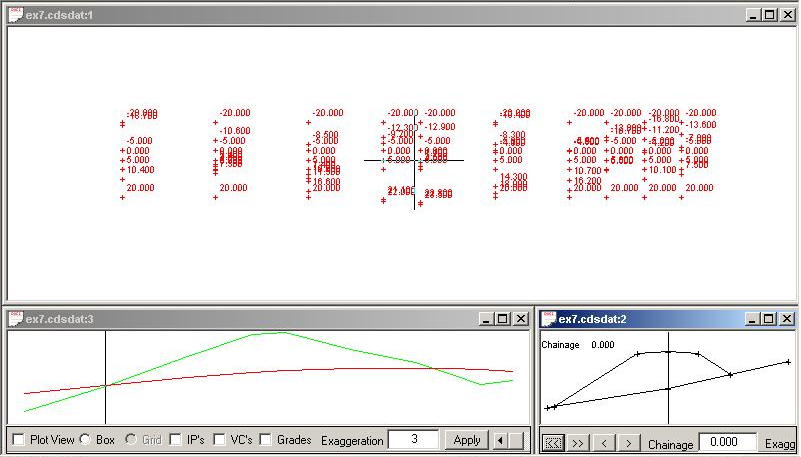
You should use the “Next” button in the cross section window to move sequentially through the sections to ensure that no glaring errors can be seen.
If you see any major irregularities in the sections, it means that your data entry has gone astray, and you should go back to the level sheets and carefully check the values you have entered.
Once the sections look vaguely sensible, it is time to determine the quantity of material that has been moved.
Calculating the Volume
Pull down the Road menu, select Volumes and then select Natural Volume Parameters. (or select the “V” icon) The screen will appear similar to that shown below.
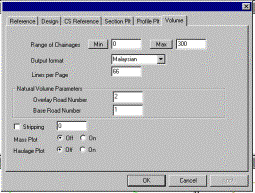
You may select the “Min” and “Max” boxes to assign the values of 0 and 300 respectively.
Next you will see the Format box, and I suggest that you experiment with the formats offered to see which is closest to what you want.
The next step is to assign the Base and Overlay roads.
Set the base road as Road1 and the overlayed road as Road2.
Once the screen has been filled in satisfactorily, select the OK button.
You are now ready to calculate the volumes
Pull down the Road menu, select Volumes, and this time select the Natural Volumes option.
The program will now load the appropriate word processor associated with a RTF (Rich Text Format) file or Excel or similar if a CSV is selected.
You may now use the facilities in WordPad to add in Project names and any other text which you might consider appropriate.
You can also scroll around, or Maximise the window to see the ultimate value of the volume, and when you are ready you can print it out if you wish.
You may then use the File, Save As options in WordPad to save the report with a suitable name, and in another format such as Word if that is appropriate.
Note also that since this report is columnar in nature, you need to use Courier, Courier New, or some other equally spaced font.
If you try and use one of the other fonts, which is not equally spaced, you will end up with ‘wavy’ columns.
|