|
|
Cross Sections from Level-Sheets
In this Tutorial you will learn how to;
-
Enter Cross Sections from Level Sheets containing Chainage, Offset and Reduced Level.
-
Review the Cross Sections and Profile on screen
-
Plot out Cross Sections and a Profile of the Centreline.
Click on CDS3 icon from desktop to start CDS. Pull down the File menu, select New. Make sure you are at the path “\Program Files\Foresoft\cds3\Tutor” and enter a JobID of ‘ex5’, and a description indicating it is data for 'Cross Sections from Level-Sheets'.
Entering the Data
Click here to display/print the data needed for this tutorial.
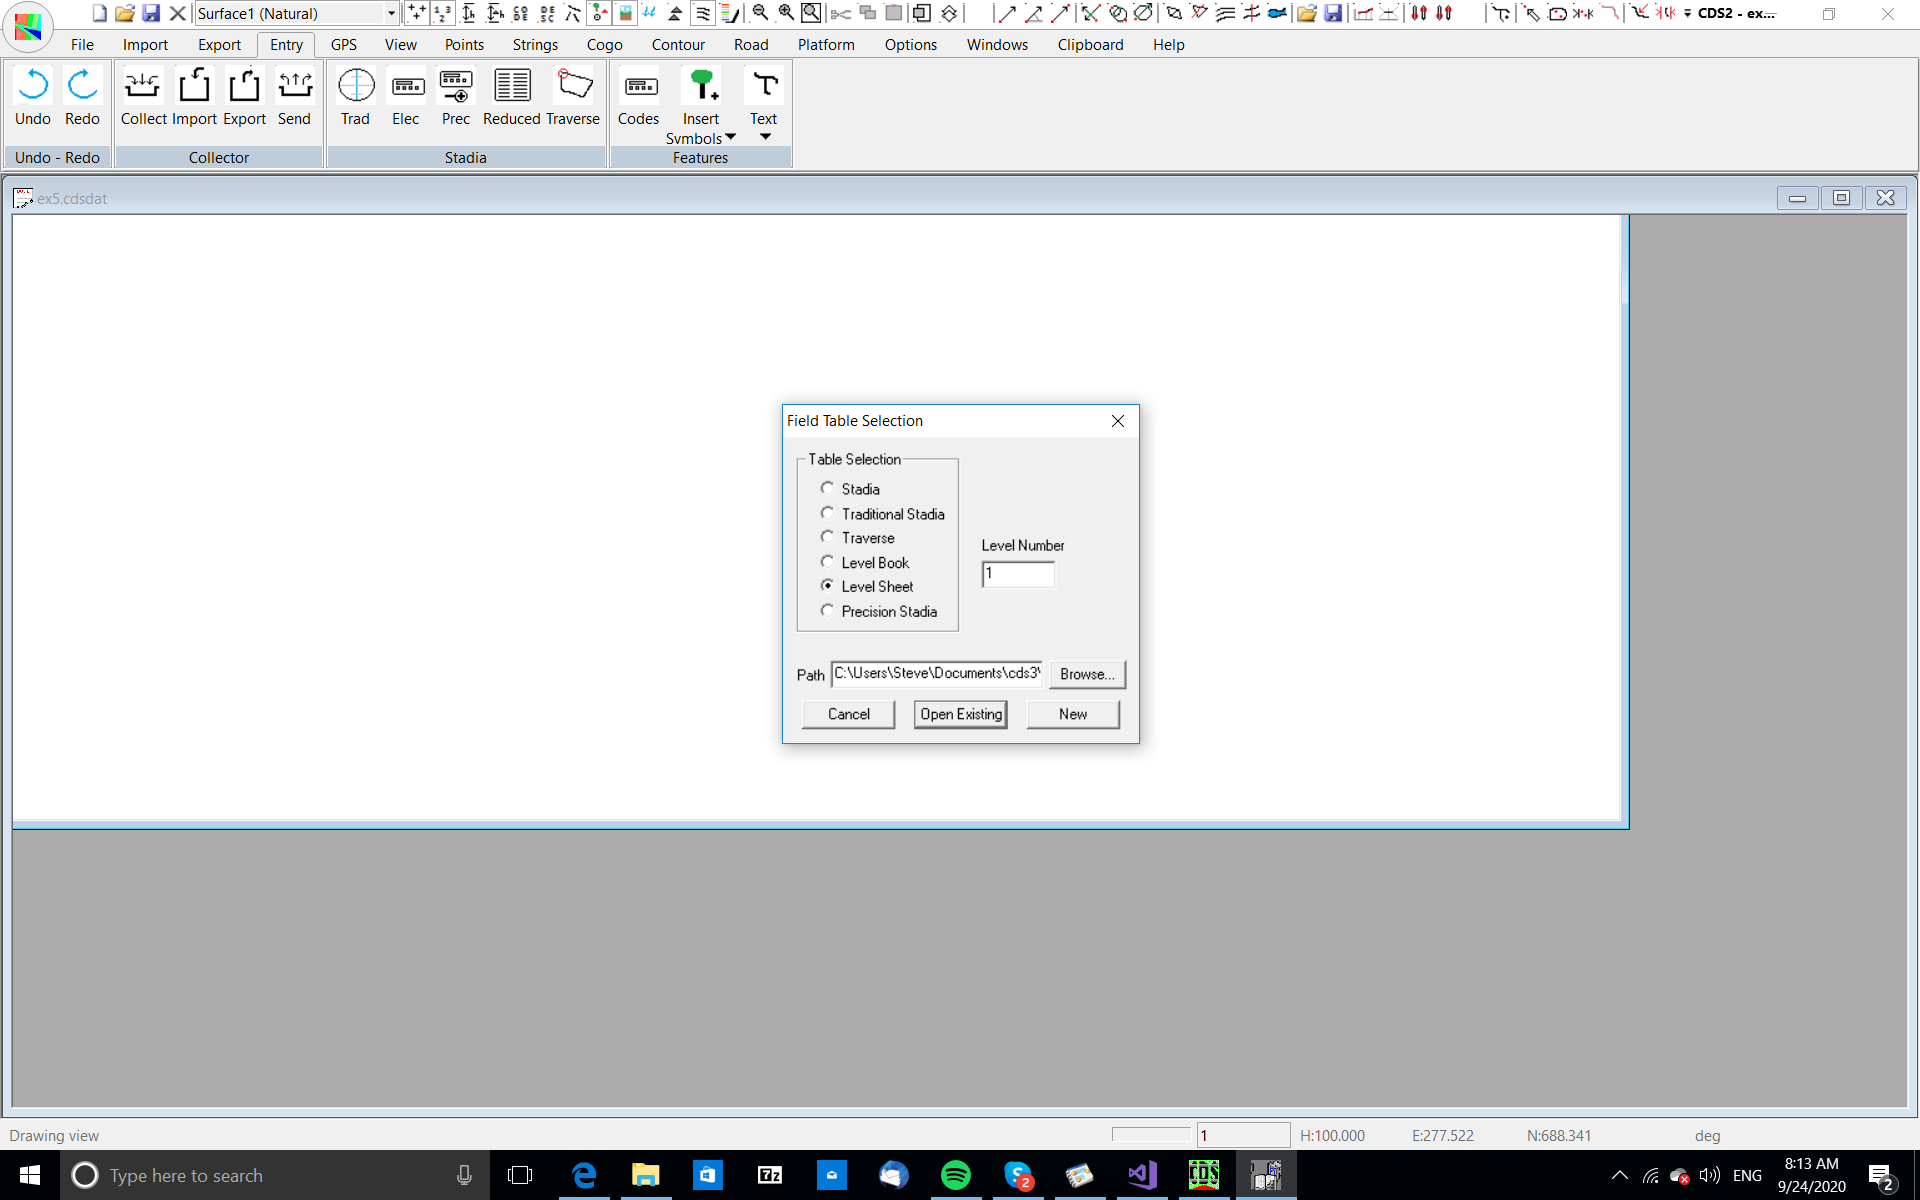
Pull down the Entry menu and select the Reduced Levels option. A screen similar to that below will appear.
|
|
Pick the New button to indicate that you need a new level sheet.
You will be asked to specify the road number for the level sheet, and can simply press the Enter key to accept the default value of Road 1 which is offered.
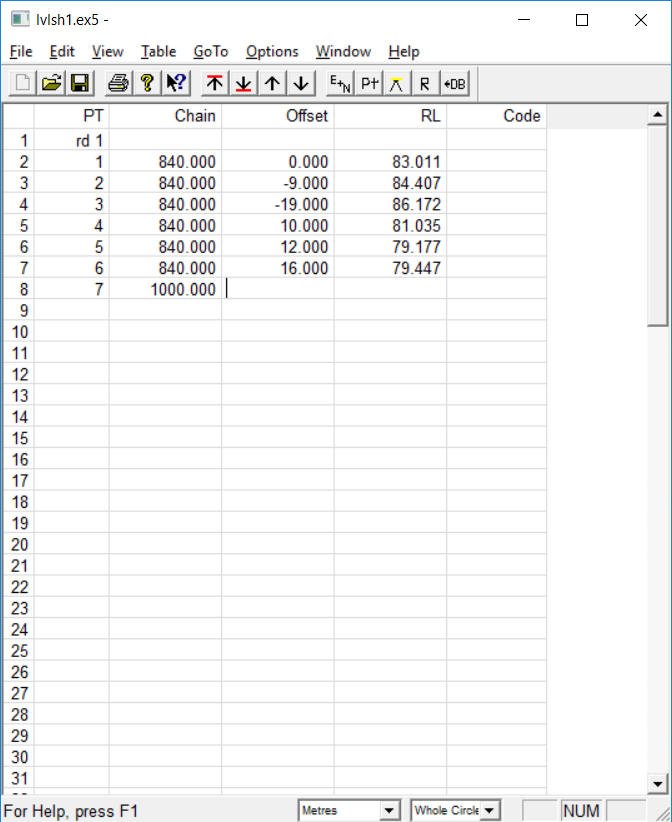
A screen similar to that below will appear, and once you press Enter to lock away the ‘rd1’ entry on the first line, you can start entering your data into the relevant columns, as shown in the sample screen.
|
|
|
When you get down to chainage 1000, you will notice that the column for chainage is not quite wide enough to fit all the numbers, so you should widen it a little to cater for your data. To do this, position your cursor on the column bar between Chainage and Offset as seen in the screen below, and you will see a double headed arrow appear. Simply move the cursor to the right to widen the column sufficiently, and then click the left mouse button to fix it in place.
Now continue entering your data until you reach the end. Note that if you make a mistake you can use the mouse or the Tab and Shifted Tab keys to move back to the relevant field and make the necessary alteration. Remember that in this entry table, as in all other entry tables offered in CDS/TRPS, you use either the Tab key, the Enter key or your mouse to move between fields, and you use your arrow keys to move within a field, in combination with the Backspace or Delete keys to make the changes you require.
Once you have finished entering the data, you can use the File menu to access the Print Preview and Print option if you require a hard copy of the entered data. The next step is to store the entered data into the database, so pull down the Options menu in the entry screen and select Store data to database. A screen will appear to allow you to control the extent of the data which you store, but in this case you wish to store all the points which is the default. Simply pick the OK button, and the points will be stored for you.
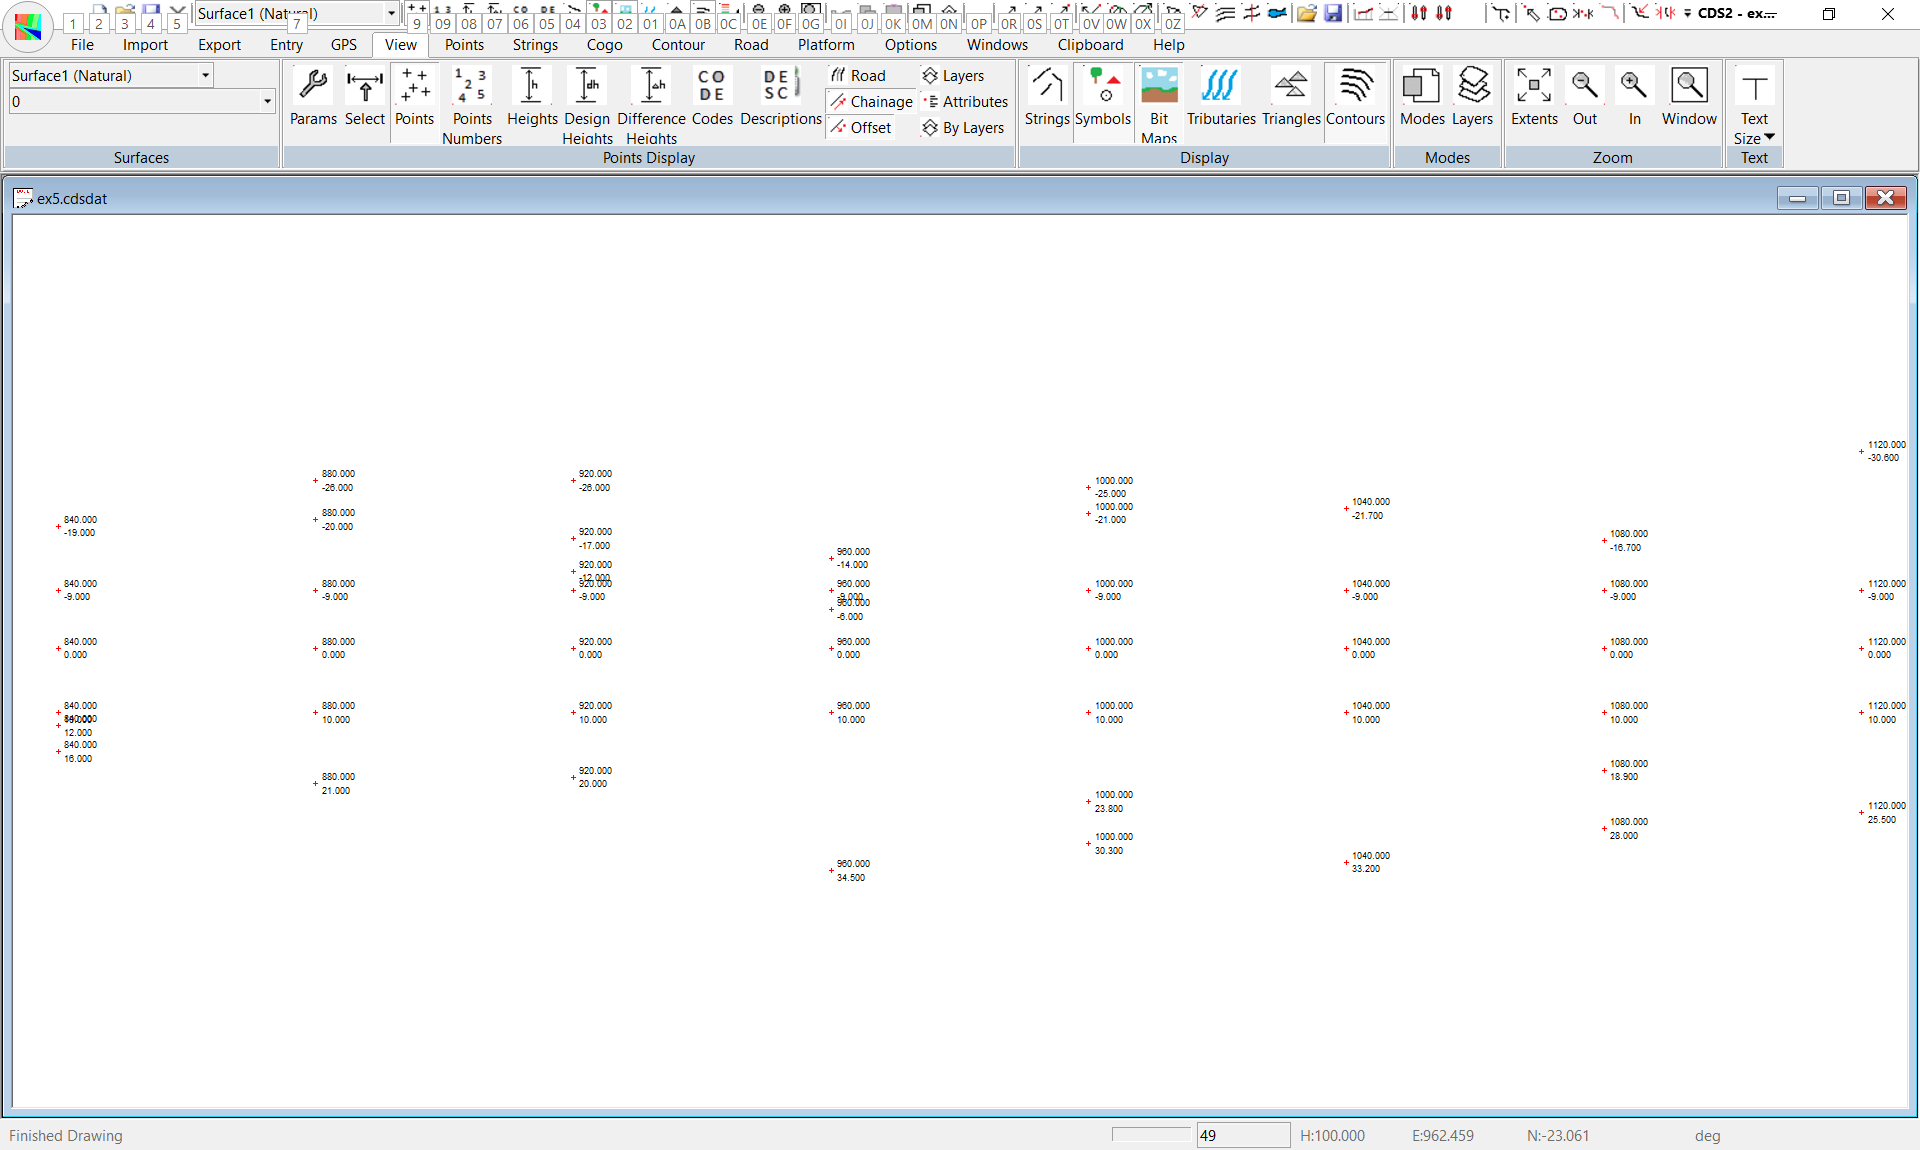
We now wish to close down the entry screen, so use either File, Close, or the close “X” at the top of the window, and answer Yes when asked if you wish to save changes to the level sheet. If you now do a Zoom Extents the points are displayed upon the screen. The points don't have an easting or northing. CDS calculates default eastings and northings from the chainage and offset.assumes the points are running in eaterly direction.
Later in these tutorials you will learn how to assign these points to an alignment and so calculate relevant coordinates for them.
We have the following plan view. We are displaying the chainage and offset for each point.
|
|
|
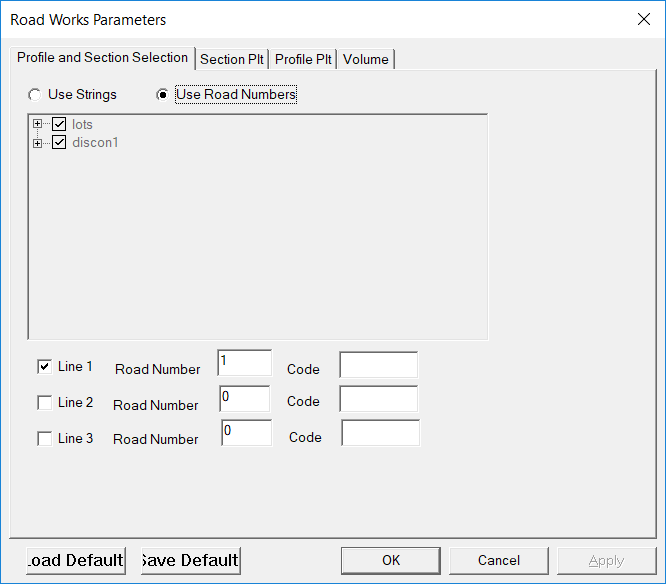
Until then, all we are really interested in is profiles and sections of the points, and these can be easily achieved with the values we have. Before going further we need to tell CDS that these points on road 1 are the points used when we wish to display profiles and sections. From Road -> Natural Criteria -> Profile Parameters - make sure that the radio button "Use Road Numbers" is active and that line1 is ticked and we are using a road number of 1. To display the profile pull down the Road Menu and select Display & Plotting. Select the Display Profile option and the screen should appear as below.
You may need to do a Zoom Extents.
|
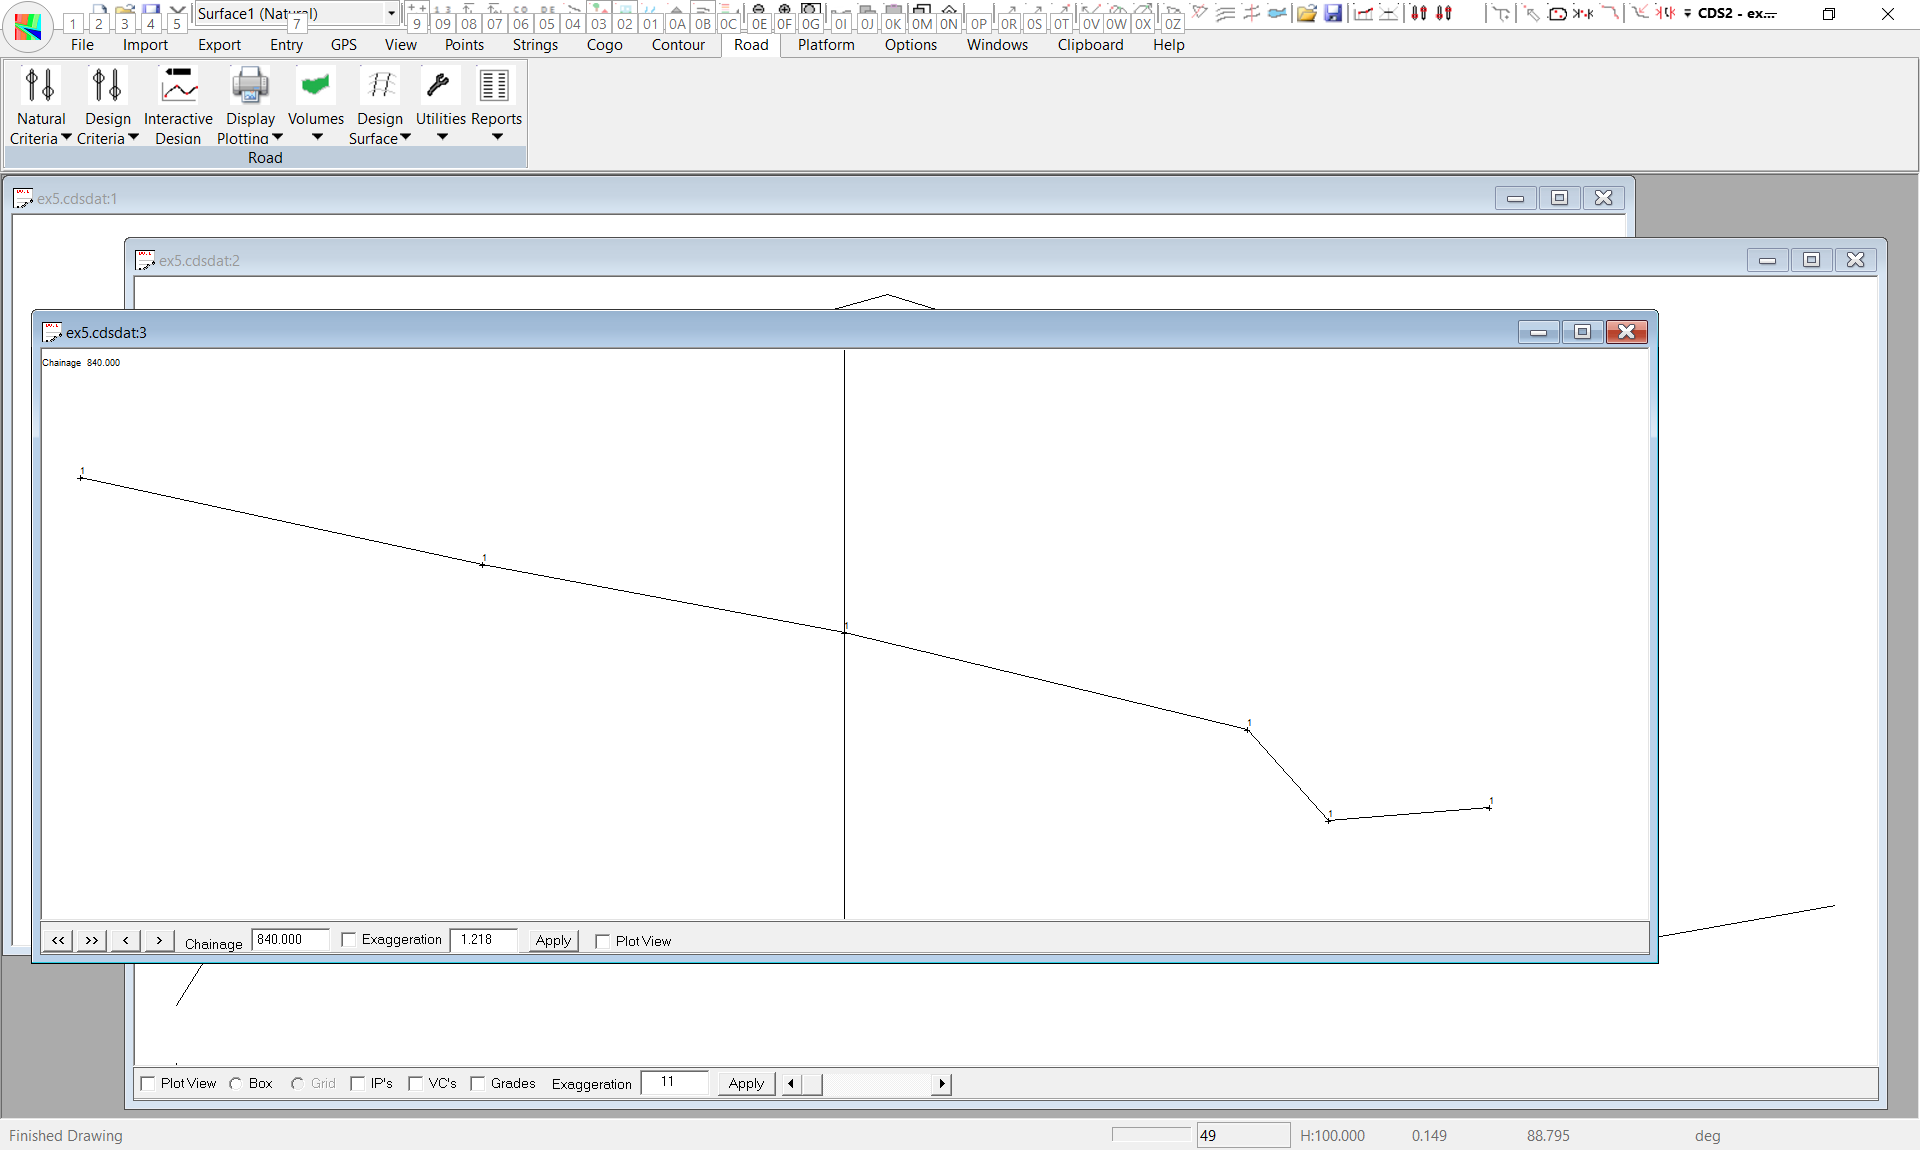
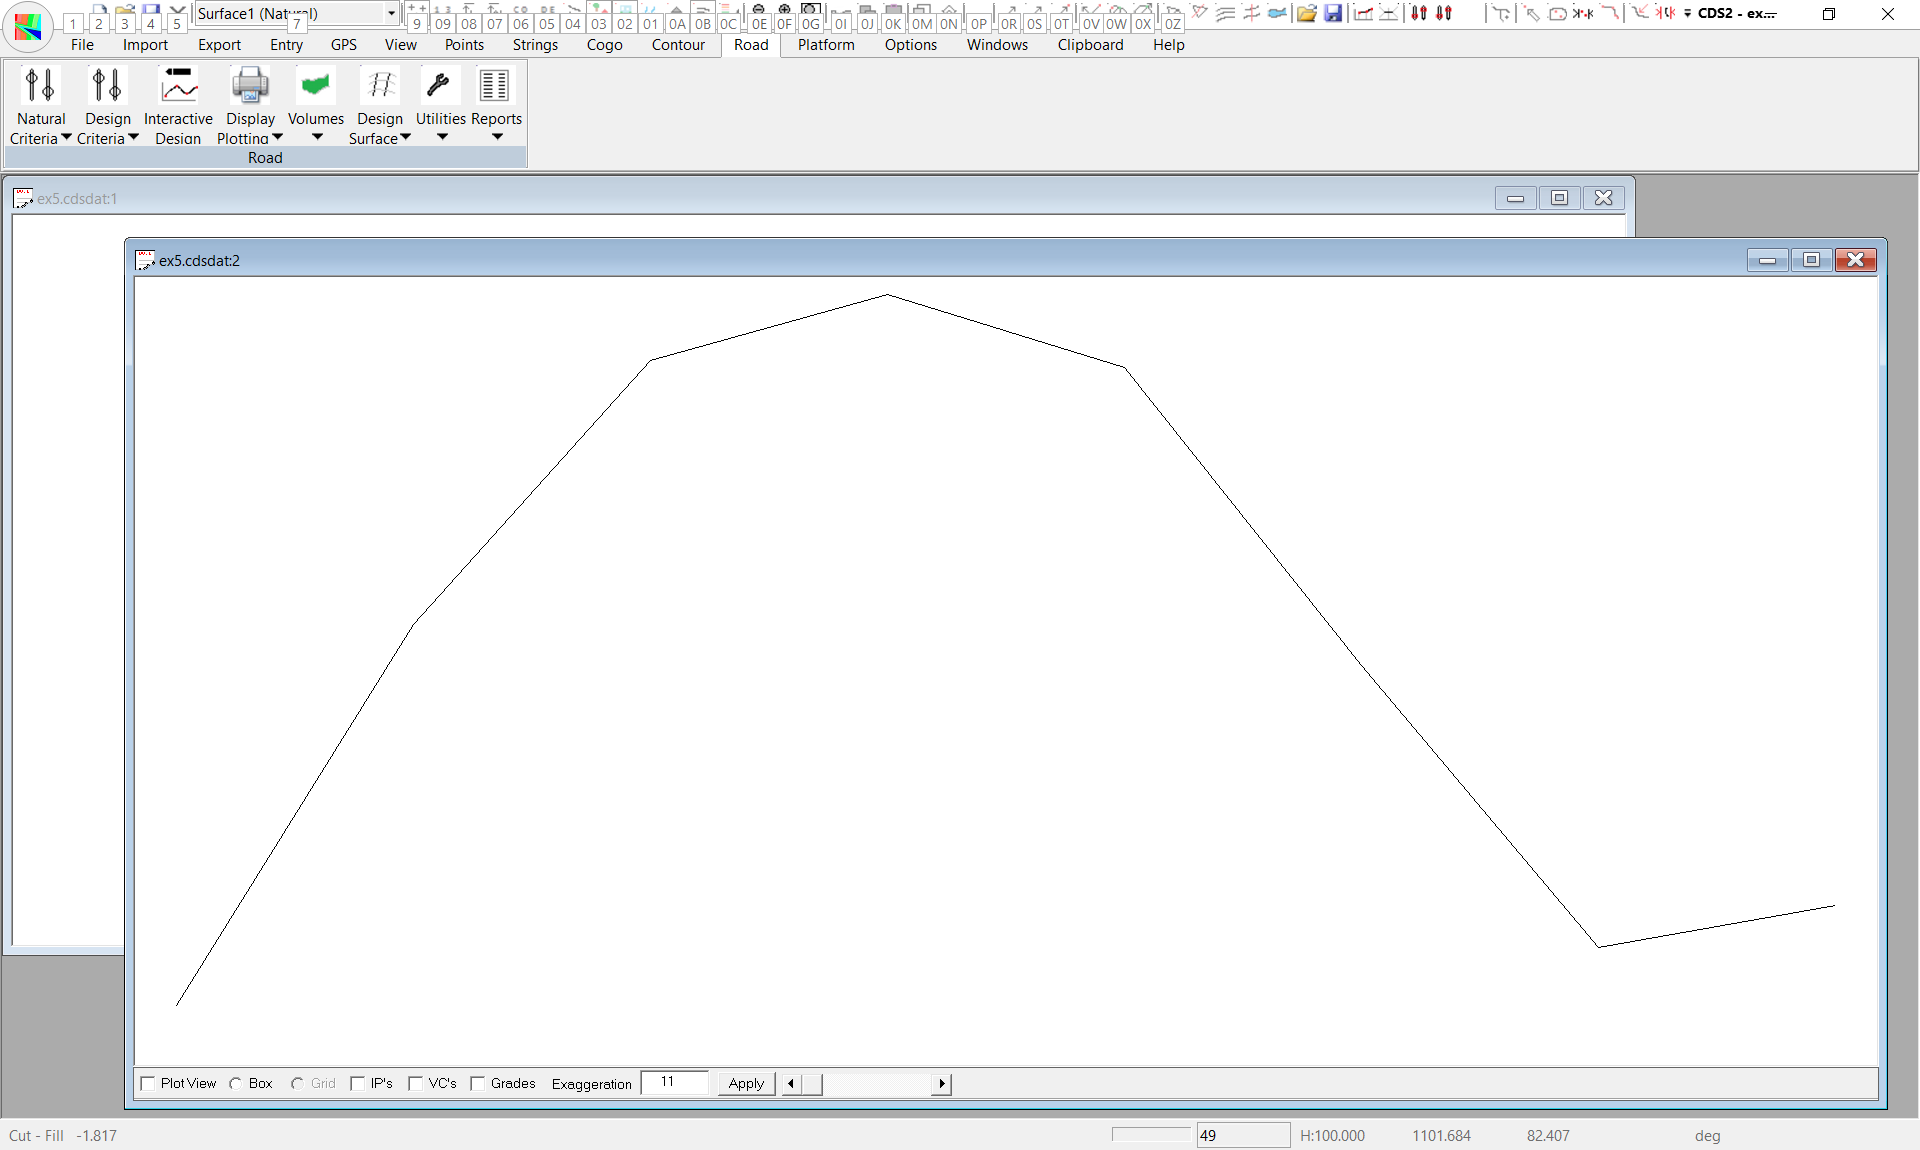
If you had more than one profile in the job you can go back into the Road Parameters and display a different profile. Next pull down the Road Menu -> Display & Plotting -> Display Section, and this time select the Display Section option, and your screen should appear as seen further below.
You can use the Next button to move sequentially through the cross sections, or if you wish to view a particular chainage you can enter the required chainage in the “Chainage” field.
|
|
For example, if you wish to view the section at chainage 1160, simply select the Chainage box with you cursor, and then type in 1160 followed by the Enter key. At the moment you can see that you have three windows displayed on your screen, and these are titled Ex5:1 (the Plan View), EX5:2 (Profile) and EX5:3 (Section). In this case, we do not have nor need the plan view, so we can close the window titled EX5:1. Make this window active by clicking inside it, and then close it.
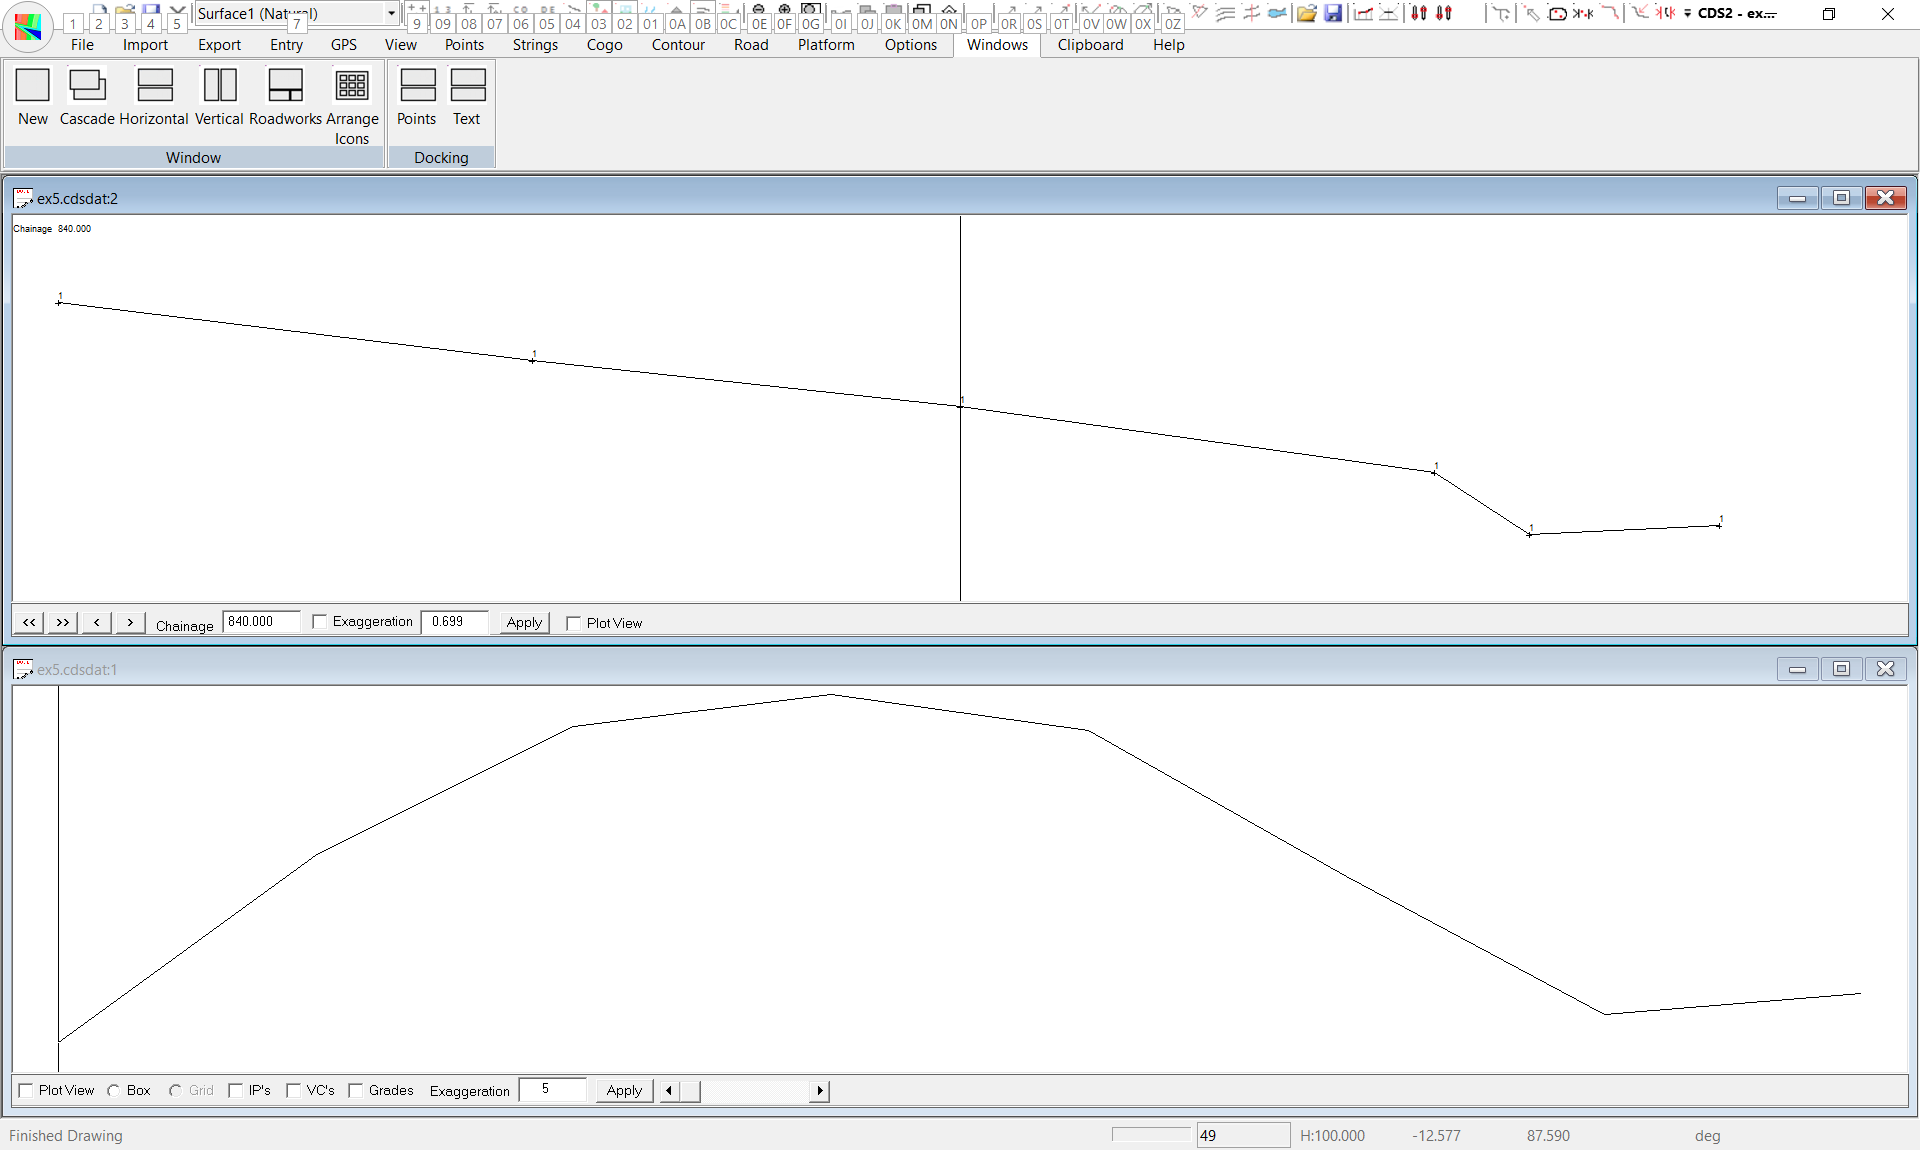
You are now left with a Profile window and a Section window which overlay one another. Pull down the Window menu, and select the option Tile Horizontally, and you will find that your screen should appear as seen at left. Note that at the bottom of the display, the second bottom line contains two fields that will change as you move your cursor around in the active window. If your cursor is in the Section window, the field on the left will display the Offset of the cursor, and the field on the right will contain the RL of the cursor. If you have the cursor in the Profile window, the field on the left will display the Chainage of the cursor, and the field on the right will contain the RL of the cursor.
|
Setting up the Printer/Plotter
|
|
Now that you have managed to get the data to display section and a profile, it is time to get ready to plot out both of these items, but before you can proceed you need to make sure that the plotter you intend to use is configured as the current Windows printing device.
Normally most windows systems have a small laser or inkjet printer configured as the default print device, and this is fine for most of the time, but now we wish to plot on a larger sheet. For example A1.
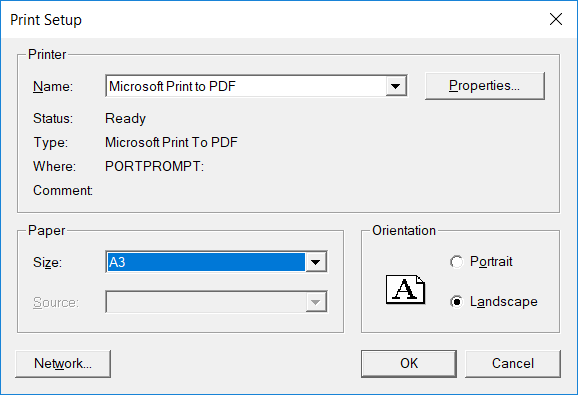
Pull down the File menu, and choose Print Setup. Now you need to pull down the list of installed printers and select your plotter. We have no idea what equipment you are likely to have installed. We will use the Microsoft Print to PDF printer driver. You will need to substitute whatever equipment you have connected to your particular computer.
Note that using this process does NOT replace the default printer. It simply sets the printer selected to be the current printer until the program is finished, and this is normally what we want.
|
In the screen at left we have used the plotter driver to select an A3 sheet of paper with a Landscape orientation, and we suggest that you need to do the same. Please note that there are a variety of other settings concerned with roll feeds or communications ports or paper types which you also need to have correctly set if you are to achieve a sensible plot. However it is beyond the scope of this tutorial to deal with all of these items and you will need to rely on your own training or local expert to guide you in these areas.
Once you have set the plotter to use some A3 paper in landscape mode you should close the Print Setup option, and ensure that the Profile window is Active.
Set Profile Parameters & Plot
|
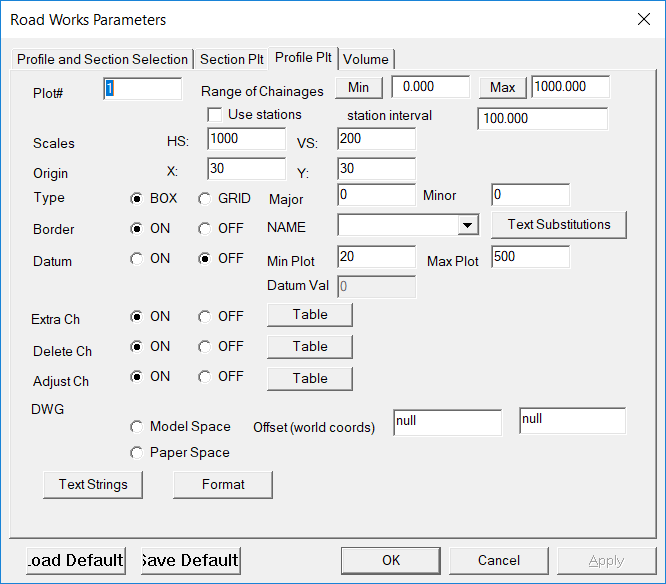
Next you need to call up the Profile parameters, which can be done by selecting Road -> Display and Plotting -> Profile parameters.
The screen shown at right should appear.
Click the box titles “Min” and you will see that the minimum chainage of 840 replaces the default of 0.
Click the Max box and the maximum chainage (1120) of the current road will be inserted.
The remainder of the defaults look fine for the moment, so select OK to save the parameters away. Next make sure that the Profile Window is active i.e it is the one with the solid bar at the top. There are additional parameters that can be accessed using the right mouse button. Select the Plot Parameter menu; it is last on the list. You are free to change any of the parameters. In this case since we don’t have a design you should unclick the design tick box.
Now pull down the File menu and select Print Preview.
|
|
|
|
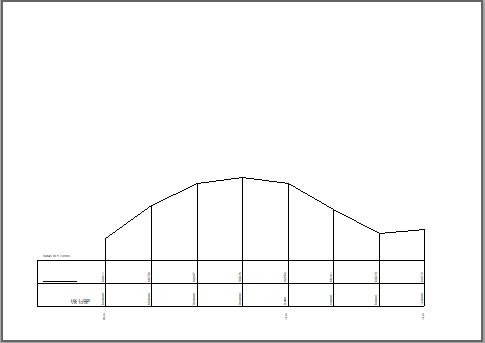
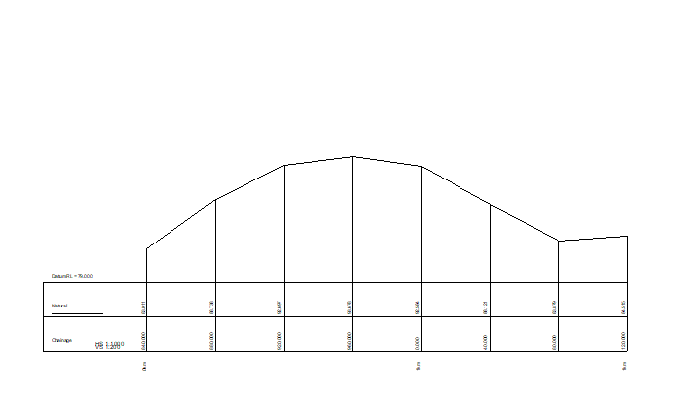
If everything has gone according to plan, the screen should appear similar to the one you can see below right. If your screen does not resemble the one shown here then you should back track through the tutorial to discover what you have set differently to what is written here. Now if you are impatient, you might be inclined to hit the Print button to get the plotter moving, but before you do that, we have a little bit of tinkering to do to get the plot a little more finished.
If you look closely in the bottom left of the plot, you will see two boxes which do not have a label to indicate what the figure represent, so we best rectify this before we waste a sheet of paper.
In this case by good luck the scaling was such that the entire profile fitted the chosen sheet. So normally you would need to go back and change the scale.
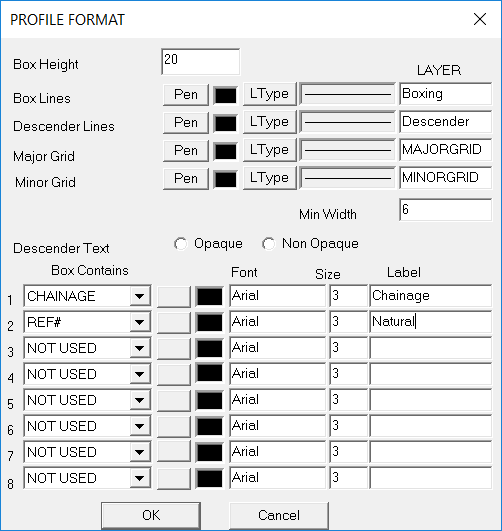
You need to provide some labels for the boxes we discovered earlier. Choose Profile Parameters again and this time when the screen appears select the Format , unlike the example screen above.
|
|
Your aim is to insert the labels “Chainage” in the field on the right of line 1, and “Natural Surface” in the label field on line 2 to make it appear identical to the screen above. If you are in an adventurous frame of mind, you may wish to play with the font settings, and choose a different font, colour and size, and we will leave it to you to discover the hours of fun which can be had trying different combinations. If you select the “Font” box between Chainage and the black square, the Font screen will appear and provide a gateway to your artistic leanings.
For this exercise, we are happy with the default font, so close down your parameter screens and then pull down the File menu, and again select Print Preview.
This time the profile will again appear, and if you use the magnifying tool in the boxes at the left of the profile you should see something very similar to the screen at left. Once you are ready, you may now commit this profile to the plotter, either directly from the Print Preview window, or by pulling down the File menu and selecting Print.
|
|
You should note that the File menu also contains options to Export the profile either to and Autocad compatible DWG file, or alternatively to a DXF file to transfer to other CAD packages.
Cross Section Parameters & Plotting
|
|
Now that it is time to deal with the cross sections, the first thing to do is to make the Section window active.
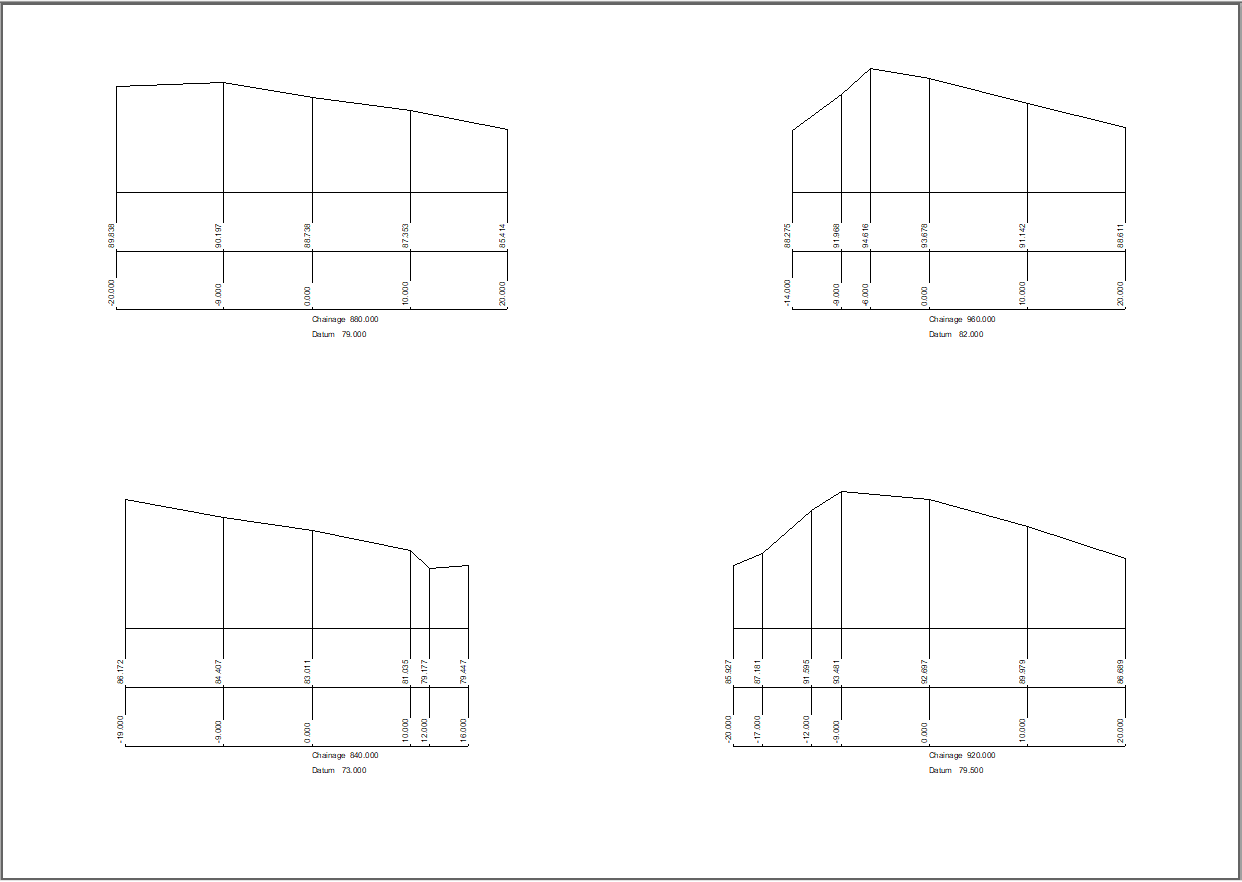
Next you need to access the Cross Section parameters, from the Road -> Display & Plotting -> Menu. Select the “Min” and “Max” in turn to insert the minimum and maximum chainage values into the relevant fields. Also click on the "Format" button and set the "offset limits". I changed them to -20 and 20.
To fit I set 2 rows by 2 columns and used a scale of 1:300.
Next close the parameter screen and pull down the File menu to select Print Preview. We should get similar to that seen on the left.
If you are not constrained in your paper size you have the possibility of increasing the rows and columns and changing the scales.
|
.
You can also export these sections to a DWG where you have more possibilities of shuffling around the sections.
|
|