| < Previous page | Next page > |
|
Preliminary Sewer/Pipe Tutorial
The Sewer/Pipe module automates and simplify's the generation of sewer/pipe profile plots. Within CDS we create a string or a series of string's which defines the plan layout of the pipe or sewer system. We can code the appropriate points on these strings to represent the varies features found along our sewer line. For example manholes or edge of roads etc. CDS then places this data into the appropriate form and runs a separate spreadsheet program that allows up to define the pipe depth's etc along the sewer. We can then either export our data to Excel or create a dwg file.
Defining Sewer
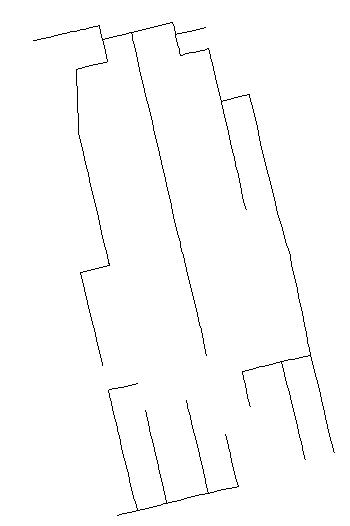
First step is to define the Sewer/Pipe network in plan view. This is done from within CDS. In the field typically only those points lying along the sewer or sewer easement are picked up. In CDS the points making up the profile are entered as strings. The strings need to be entered into the folder “sewer”. Further each point on the strings need to be coded to tell the Sewer/Pipe module what each point represents. At present the following codes are pre-defined. However you may add or delete codes as you require.
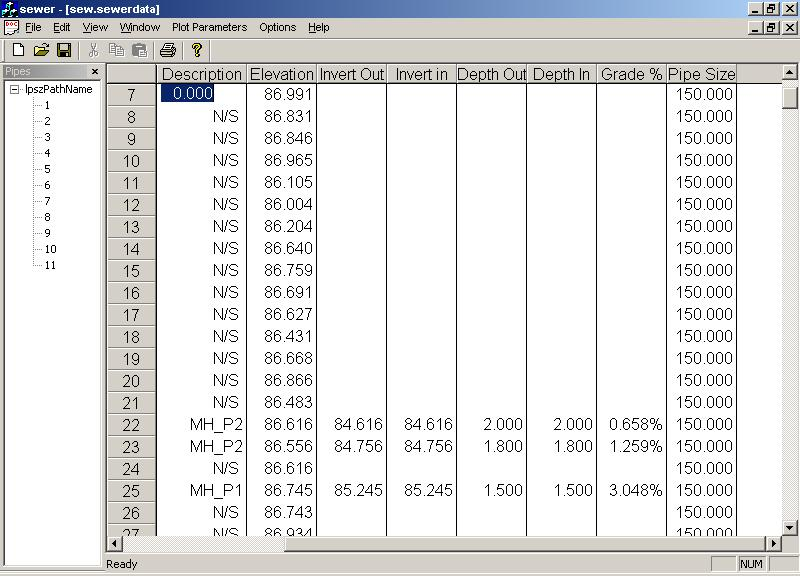
The next step is to fill in the DepthOut and DepthIn depths. We have used a Depth Out of 3 and and a Depth In of 2 as an initial design. The output plot will show this is quite invalid in places but it get's us started. Also note that only codes 0,1 or 2 allow you to enter the invert depths. The depth in, depth out and grades are calculated automatically from the height and invert level.
Before creating a plot we also may need to set the plot parameters. Select the “Plot Parameters” menu item and you can modify the appropriate parameters.
Creating output printout and/or dwg file
At present the print-out is not presently implemented; however the create dwg is implemented.
From “File” menu select the “Export Dwg” . If Autocad or similar is installed on your computer then the line profile is displayed for the appropriate line that we are working on. Part of the output plot for this line is seen below:
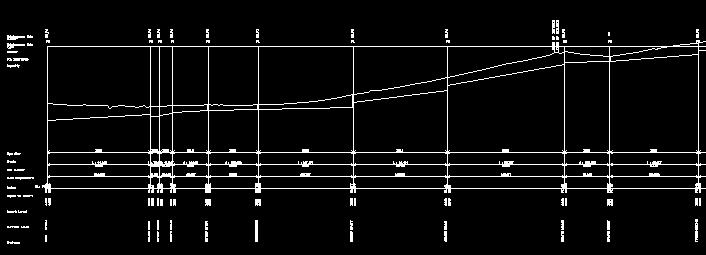
Obviously the design of some of the DepthOut and DepthIn pits are invalid and these can be designed appropriately. The other sewer line tables can be filled out in whichever order required and a dwg plot created.
|