| < Previous page | Next page > |
|
Printing / Plotting Overview
CDS performs it's printing operations through the Windows printer drivers. This means that any printer supported by windows is supported by CDS. CDS also has the ability to create "dwg" files directly. If there are any programs on the system with the ability to display a dwg file and the appropriate "file association" has been set up within windows then the dwg file is automatically displayed.
Output directly to printer
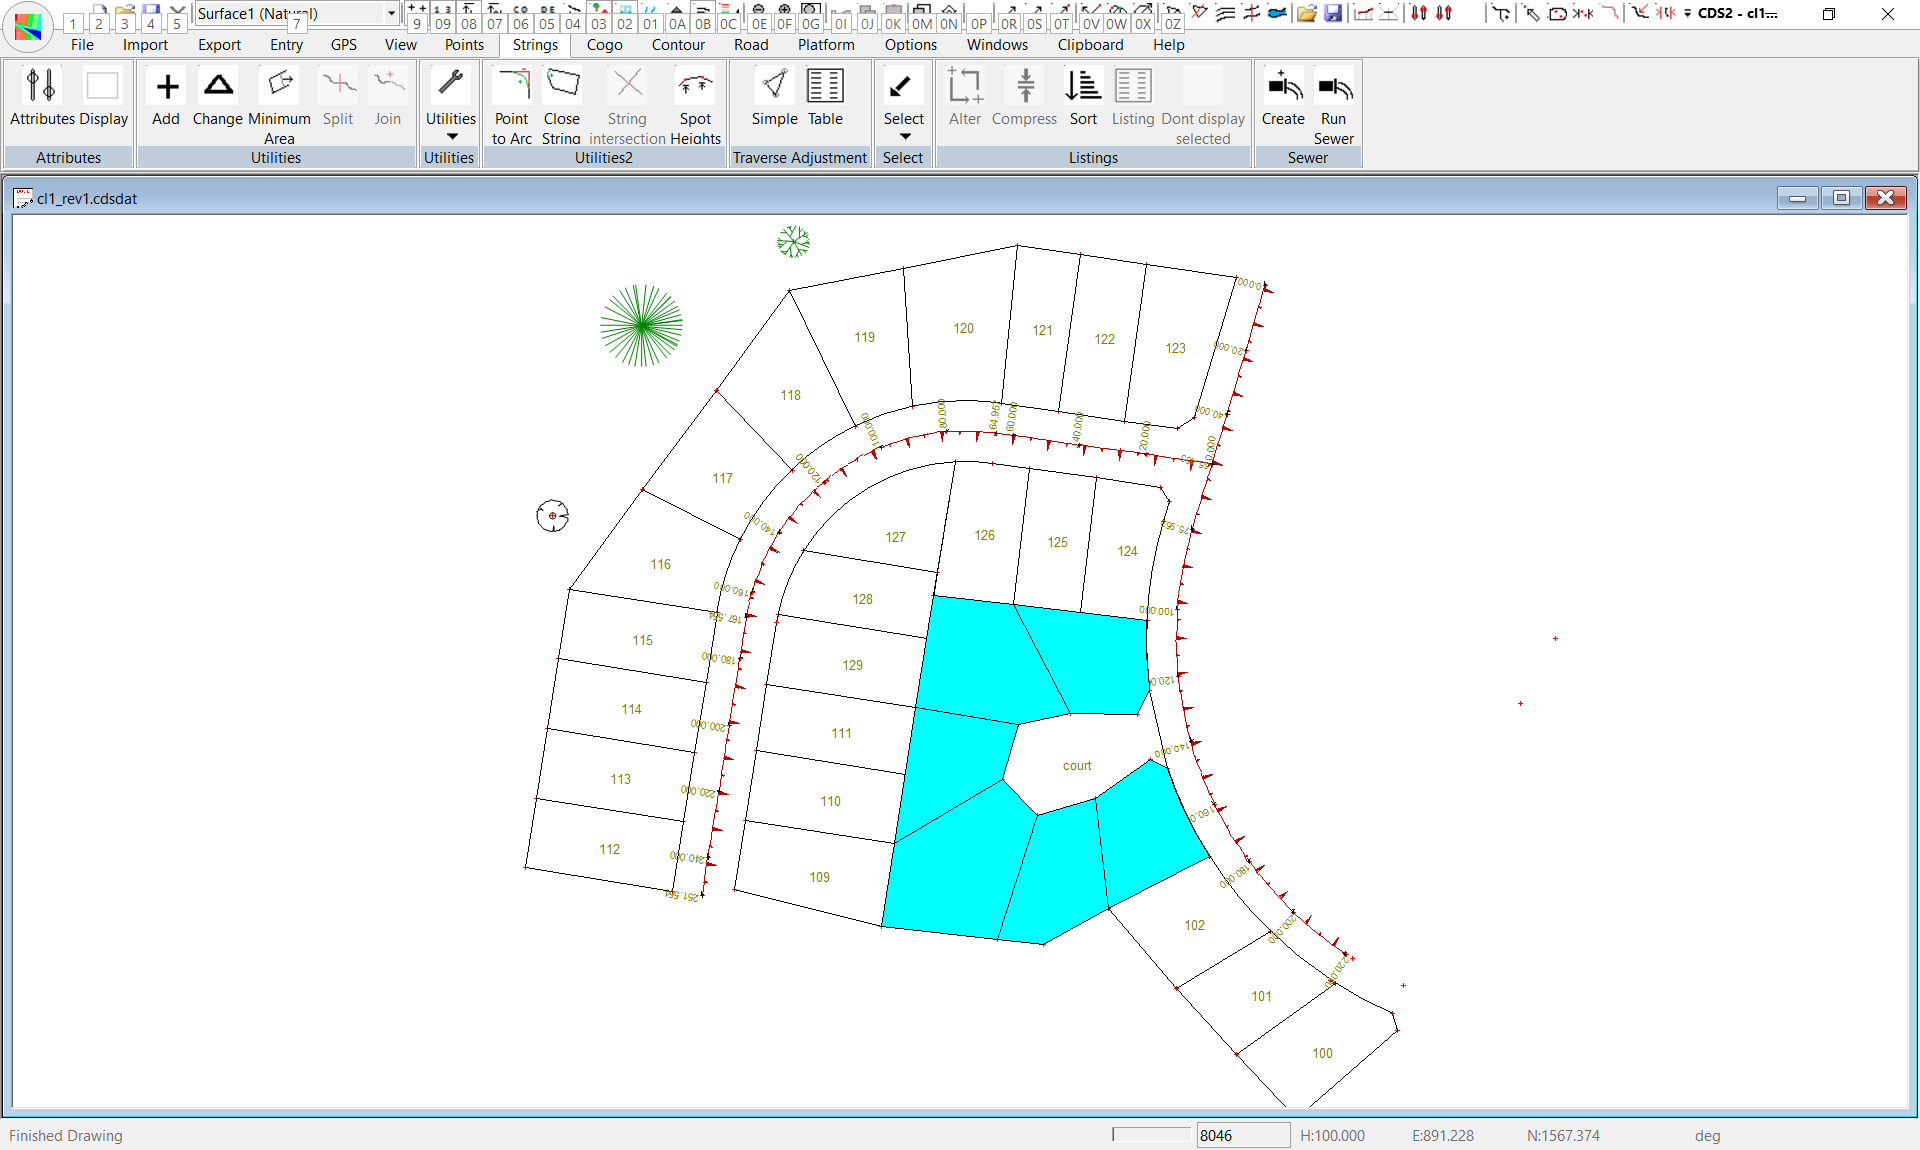
Creating a plan print directly from CDS is relatively straight forward. The following shows you what to do. If you open up the job "cl1" in the tutorial directory we will have something to start with. At this time it would be worthwhile reviewing the tutorial on string attributes to refresh your memory on how to fill in some of the closed strings. How to display "string ID's" as well as how you would display chainages along the road strings (Stn equations if you are from North America). In this example I have also clicked in some randomn points along the western boundary and attached some tree symbols to these points. See the tutorial "Feature coding, symbols and text" for a refresher on how this is achieved. You should be able to achieve something similar to that below.
In this tutorial we wish to quickly produce a fast; professional looking output that we can deliver to our client. We have an A4 laser printer that we are going to use. First step is to make sure that CDS is setup to use this printer. From the "File" menu select "Print Setup". This opens up a windows common dialog where you can select the printer, paper size and orientation. CDS will now remember these settings. The next step is to open up the "Plot Parameters" tabbed dialog to fine tune the plotting. From the "File" menu select "Plot Parameters". The plot parameter main dialog is seen below:
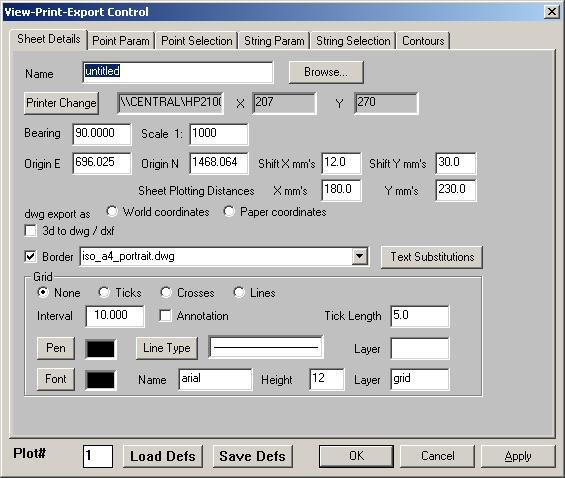
The first point to note is that you can have virtually unlimited different plots and store the data with that view. The Plot# on bottom left stores all the data with that view. to create a second view type 2 into the Plot# and hit tab key. You can then define the second plot without changing anything defined in the first plot.
Please take note of the following. In this example we wish to create a plot at a scale of 1:1000. The origin of the paper can be defined graphically by moving the sheet around the page. The option is there for also changing these values by typing in the needed values. CDS has an option for also creating a Border as we go. This border is defined as a dwg file. If you don't have Autocad or equivalent there are a small number of predefined dwg border files supplied that you may use as is. To use a border tick the "Border" tick box and select a border dwg file from the drop down combo box.
If you need to define your own border file or you wish to modify an existing then you will need Autocad or compatible. A free alternative is NanoCad. The appropriate border files are found in the variable directory - for example "c:\program files\foresight software\cds\variable" The main rules to follow when creating your own is as follows
At present there are a small number of gotcha's that will be addressed in the near future. The major one is that text font's are presently ignored on output plot. An internal font is used. Not all dwg entity's presently come across. For example hatching. If you are developing your own border and there is something missing can you please email us the dwg and we will implement the appropriate entity's for you.
The next thing to observe on the "Plot Parameters" screen is the "Text Substitution" button. This brings up a table that you may fill in. The entries on the left are text strings found in the border dwg file while the corresponding right hand entry's are what the original text is replaced with. A dump of the table is seen below
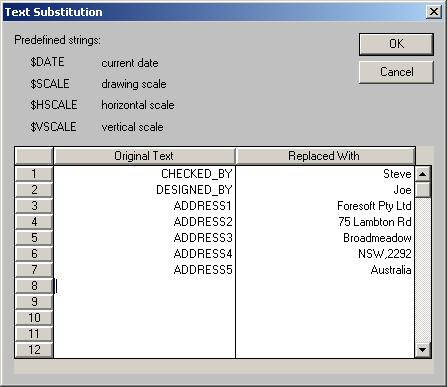
As mentioned if you need to define a new entry; make sure that you insert a piece of text in to the border dwg file and that you put in an equivalent entry into the table with what you wish the output to read.
Defining the plot view position
We are now in a position to create a plot. In this example we wish to use a border and we have selected the predefined border iso_a4_portrait. To fit a picture into this border we need to set an offset on where the data plot starts and also a distance left and to the top where we stop so that the border is not overwritten. On the "Plot Parameter" main screen these are "Shift X" and "Shift Y" values together with the "Sheet plotting distances" X and Y. For this example we have added in a start point of 12mm and Y of 35mm. The distances across and up are 180 and 230 respectively. To position the plot select "Position Plot Window" from the "File" menu. The following screen shot shows the plot view superimposed upon the screen.
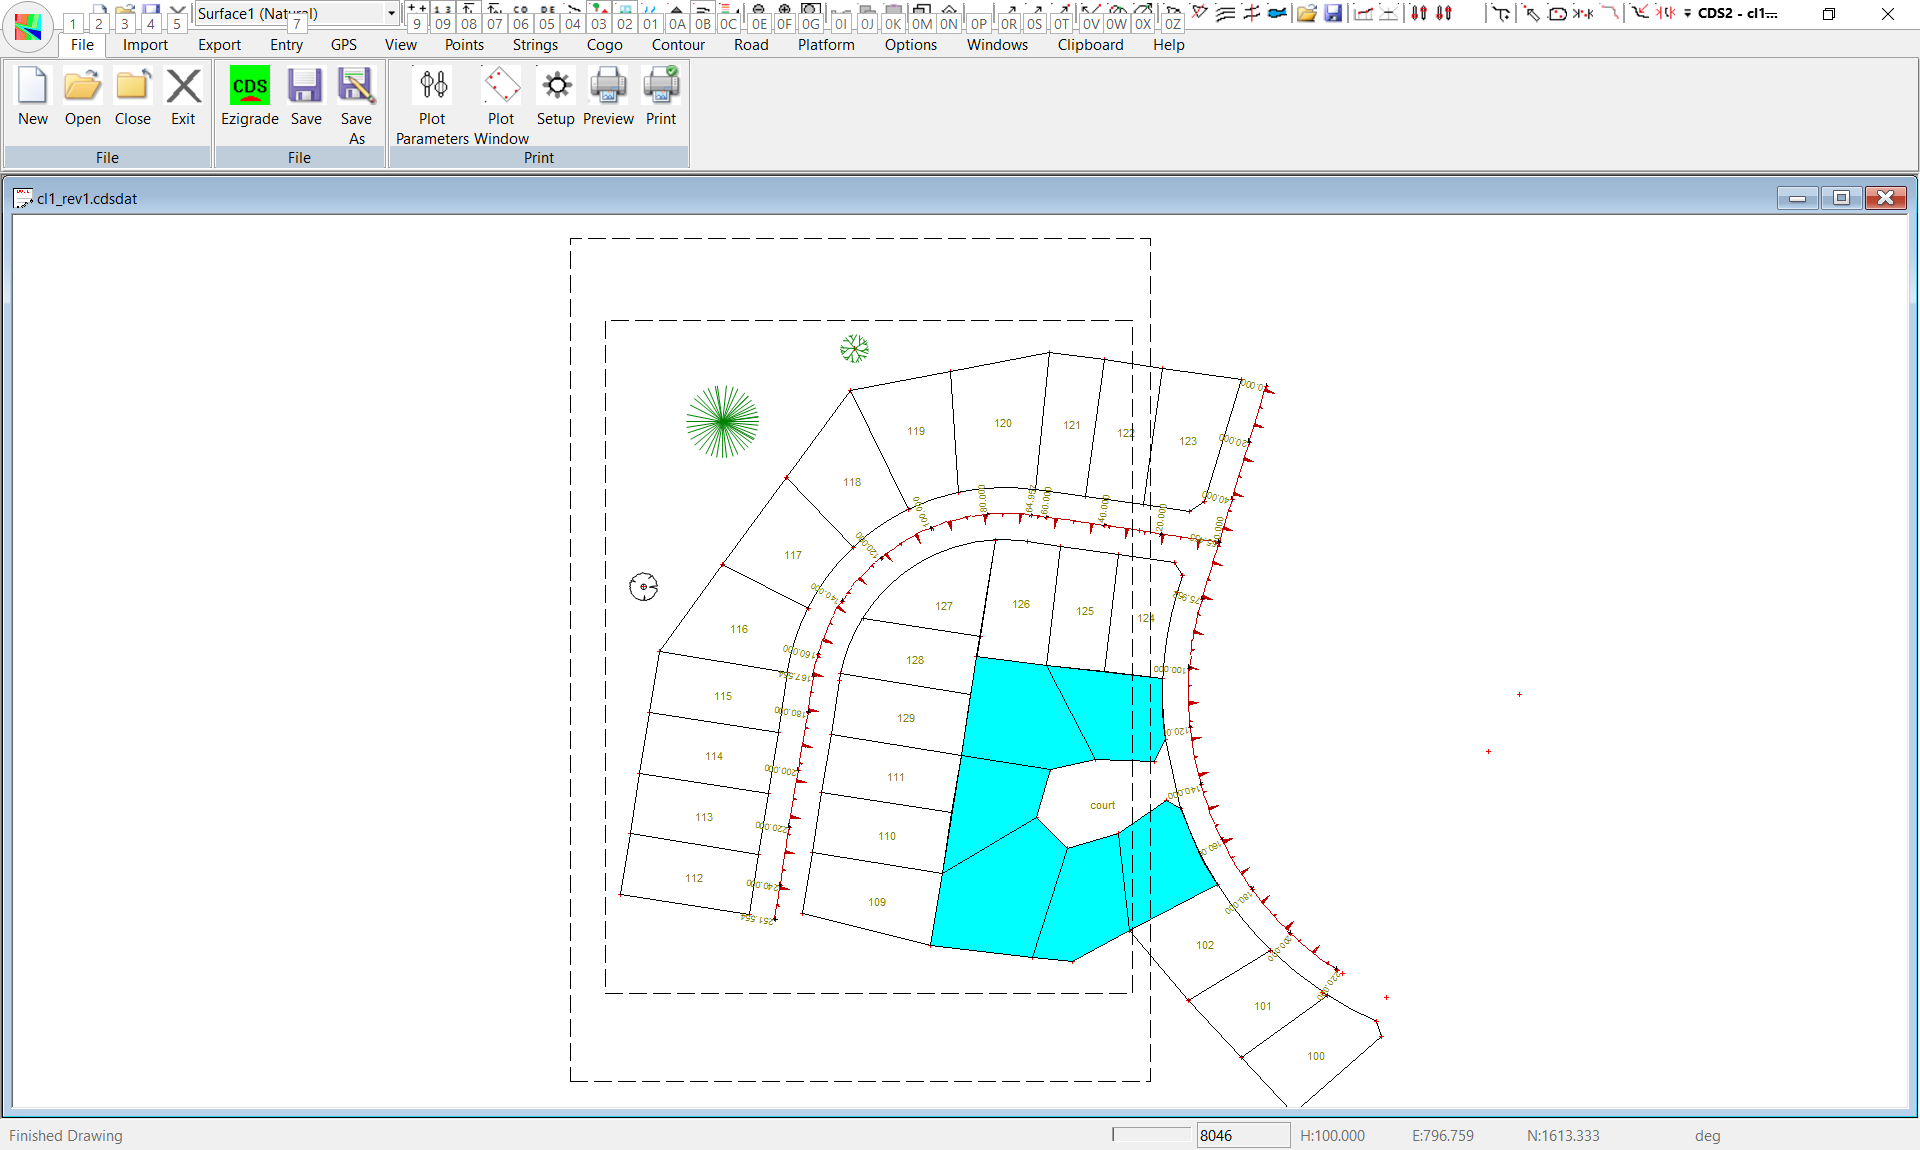
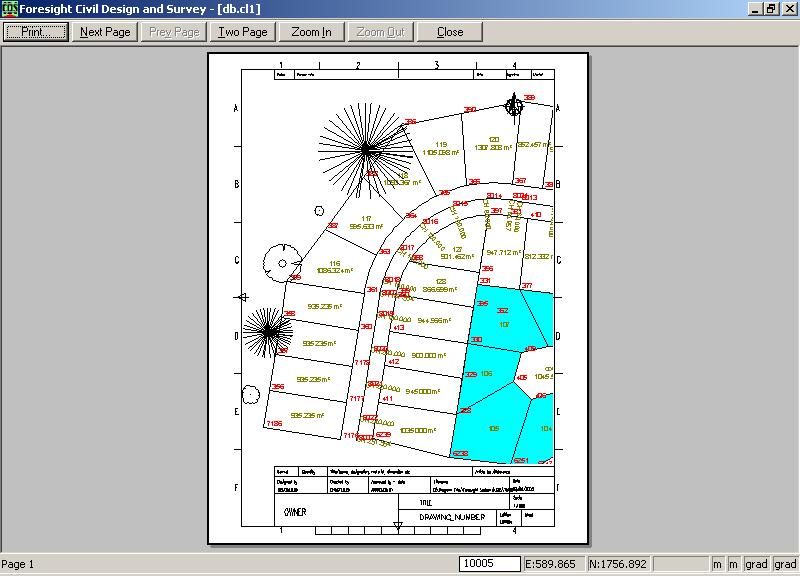
You may now create the print/plot from the "File" print menu item. The plot shown in the print preview is below:
Outputting to a dwg file
CDS is predominately a Civil Engineering / Surveying tool; not a CAD editor. Sometimes the output from CDS needs to be enhanced in some way. To this end CDS allows you to export the database / drawing to a dwg editor such as Autocad for any needed CAD enhancements. We have the option of either exporting in "world" or "paper" coordinates.
For experienced Autocad operators it is suggested that the output is created in world coordinates. In this format the job is exported and all the coordinates have there true coordinates. To create an output use your predefined border templates in paper space views and create your plots from Autocad when and where you need them. If you create a world dwg file please make sure that you don't have the border ticked. The border also comes across in model space; but with coordinates that are unlikely to match up with your real world coordinates.
For those operators who wish to use Autocad etc for touch-ups etc you now have the option of creating the drawing in paper dimensions. In this mode the DWG file created is identical to what you would have if you were printing directly out of windows. The dwg coordinates are in paper coordinates. In this mode the border is displayed and any text substitutions are performed. Also any appropriate rotations are done. You may simply enhance the drawing if appropriate and print out at a 1:1 scale from Autocad.
Outputting to a PDF
Often you wish to share your plots with others who don't have CDS or don't have Autocad. Simply do a print and select the "Microsoft Print to PDF" which I believe ships as standard with Windows 10 operating system.
Printing / Plotting profiles and sections
This is done in a similiar manner. The appropriate text substitution table cans be found. In these cases any dwg files produced are always in paper dimensions.
|